Article Text

Abstract
Background Cardiovascular disease (CVD) prediction is problematic within groups of obese adolescents as measures such as adiposity and metabolic markers lack validation. Pulse wave velocity (PWV), a proxy for arterial stiffening, is a potential way to contemporaneously capture adolescents at greater risk of CVD.
Objectives To investigate associations between PWV and 1) adiposity and 2) other conventional metabolic factors in a community sample of (>95th centile body mass index (BMI)).
Design and setting Cross-sectional measurement and analysis in a hospital-based research centre drawn from a community sample of adolescents recruited to an obesity intervention at baseline.
Patients 174 adolescents (12-19 years) with obesity (>95th centile BMI). 37% were male, while 66 (38%) were white, 53 (30%) black, 36 (21%) South Asian, 19 (11%) mixed/other. Participants with endocrine, genetic causes of obesity and chronic medical conditions (excluding asthma) were excluded.
Measures BMI z-score (zBMI), waist z-score, fat mass index (FMI: measured using bioimpedance), sagittal abdominal dimension (SAD), cardiometabolic blood tests and resting blood pressure (BP) were collected. Carotid-radial PWV was measured by a single operator.
Results PWV was associated with age but not pubertal stage. PWV was positively associated with adiposity (zBMI: coefficient 0.44 (95% CI 0.08 to 0.79); FMI: coefficient 0.05 (95% CI 0.00 to 0.10); waist z-score: coefficient 0.27 (95% CI 0.00 to 0.53); SAD: coefficient 0.06 (95% CI: 0.00 to 0.12)). There was no association between PWV and BP, and few associations with cardiometabolic bloods. Associations between PWV and adiposity measures were robust to adjustment in multivariable models except for SAD. Participants with zBMI >2.5 SD and >3.5 SD had greater average PWV but overlap between groups was large.
Conclusions In our sample, increasing adiposity was positively associated with arterial stiffness, however partitioning by severity was not reliable. Lack of associations between BP, cardiometabolic bloods and arterial stiffness questions the reliability of these factors for predicting CVD risk in adolescents with obesity.
- obesity
- metabolic
- adolescent health
This is an Open Access article distributed in accordance with the Creative Commons Attribution Non Commercial (CC BY-NC 4.0) license, which permits others to distribute, remix, adapt, build upon this work non-commercially, and license their derivative works on different terms, provided the original work is properly cited and the use is non-commercial. See: http://creativecommons.org/licenses/by-nc/4.0/
Statistics from Altmetric.com
What is already known on this topic?
Pulse wave velocity (PWV) has been shown to be greater in children with obesity compared with healthy weight controls.
Validity of degree of adiposity, metabolic blood markers and blood pressure as predictors of long-term cardiovascular disease within obese groups of adolescents is unclear.
What this study adds?
Adiposity was associated with PWV yet overlap of distributions when partitioned by obesity severity calls into question what constitutes 'severe obesity' for cardiovascular risk.
PWV was not associated with blood pressure and with few other metabolic markers.
Introduction
Rising obesity rates among children and young people (CYP) have presented the new challenge of identifying which groups, and which patients in the clinical setting, require focus for interventions for both weight loss programmes and possible active medical management.1 2 Current medical management algorithms for CYP obesity use severity of obesity (based on body mass index (BMI) classification) and family history as proxies for cardiovascular disease (CVD) risk to classify individuals for further assessment and treatment.3 4 However, conventional cut-offs to define obesity in childhood5 (such as above the 95th centile,4 International Obesity Task Force cut-offs6 and >2.5 SDs7 and >3.5 SD for severe obesity3) currently lack validation as predictors of long-term CVD risk. Published studies examining the usefulness of cut-offs have focused on their ability to capture components of the ‘metabolic syndrome’, that is, established adult CVD risk factors such as hypertension and dyslipidemia,7–9 as well as reporting the tracking of children defined with obesity into adulthood.10 11 Evidence to support the importance of such metabolic risk factors as predictors of future CVD risk in children, either individually or in combination,12–14 is also limited; and their persistence may be temporally unstable through adolescence.15 Predicting CVD risk in young people with obesity therefore remains problematic, especially in the clinical setting for individual patients.16 17
Another approach for exploring current CVD risk in adolescents with obesity is to seek contemporaneous evidence of arterial stiffening,18 19 with pulse wave velocity (PWV) being a potentially useful and non-invasive proxy.20–22 A derivative gradient velocity calculated from pulse waveforms at two separate peripheral arterial loci and the distance between them (with PWV proportional to arterial stiffness), PWV is reproducible,22 23 correlates with arterial plaque load in adults24 and accurately predicts CVD mortality in adults.25 26 Two meta-analyses have demonstrated that CYP with obesity have greater PWV compared with non-obese controls.27 28 Studies have examined the relationship between adiposity and PWV at various anatomical sites in children and adolescents combining healthy and overweight status with variable findings.29–36 However, the majority of these studies have not used standardised measures of adiposity (ie, z-scores of BMI and waist circumference), and have not adjusted for other potential key factors such as puberty and ethnicity.18 Such information is important when considering CVD risk for patients within obese groups of CYP.
We used data from a cross-sectional, community sample of adolescents with obesity recruited into an obesity intervention trial to examine the associations of contemporary arterial stiffening, using PWV, with multiple measures of adiposity, conventional markers of metabolic risk (blood pressure (BP) and cardiometabolic blood markers) and pubertal status and ethnicity. We hypothesised that arterial stiffness would increase with degree of adiposity and would be positively associated with other cardiovascular risk factors, in particular BP. We also examined whether different thresholds, commonly used to partition groups of obese CYP for defining severe obesity, were associated with PWV differently.
Materials and methods
Data were obtained from the baseline sample of the Healthy Eating and Lifestyle Trial (HELP) trial, a randomised controlled trial of an adolescent obesity intervention.37 Adolescents aged 12–19 years were recruited from community sources (including general practitioners, schools, youth groups and self referral) in the Greater London area between January 2011 and July 2013. Individuals with chronic illnesses (excluding asthma or more minor chronic conditions such as eczema), genetic or endocrine causes of obesity and those with diagnosed mental health problems were excluded. Participants were assessed at the Clinical Research Facility at Great Ormond Street Hospital at baseline (before randomisation) by a physician. Trained nurses collected the data using standardised protocols and the same equipment throughout. Ethics permission for the study was provided by the regional, central London ethics committee.
Ethnicity was self-reported and categorised as white, black, South Asian or mixed/other ethnicity. Participants were asked to self-report their pubertal status using standardised diagrams38 and report of menarcheal status in girls. Pubertal status was then categorised as pre/early (Tanner stages 1 and 2), mid (Tanner 3 and 4), late/complete (Tanner stage 5). Girls postmenarche were grouped as late/complete by default. Self-report data on smoking were provided by young people, with participants grouped into binary groups in two ways: 1) as ‘current smokers’ (ie, current vs non-smoker or ex-smoker) and 2) ‘ever smoked’ (current and ex-smoker vs non-smoker).
Anthropometry
Heights were measured to the nearest 0.1 cm using an electronic stadiometer (Seca 242 Electronic Measuring Rod, Seca GmbH, Germany). Weight and 4-limb bioimpedence were measured to the nearest 0.01 kg on the Tanita BC 418MA (Tanita, UK), in loose clothing. Total impedance was used to calculate fat mass (kg) using a validated formula for use in adolescents with obesity.39 Waist circumference was measured midway between the 10th rib and iliac crest to the nearest mm using a non-elastic flexible tape in the standing position,40 with values averaged over three measurements. Anterior-posterior sagittal abdominal dimension (SAD) was measured to the nearest 0.1 cm by calliper (Holtain Kahn abdominal calliper, Holtain, UK) at the centre of the abdomen following exhalation with participants in a supine position.41 BMI was calculated as weight (kg)/height (m)2, and fat mass index (FMI) was calculated as fat mass (kg)/height (m)2. Standardised BMI and waist circumference z-scores (zBMI and waist-z) were calculated using the LMSgrowth program V.2.69 (Harlow Healthcare, UK) using the UK 1990 growth reference data.42 43 Raw data were used for FMI and SAD as no validated standardised data are available. Obesity status was categorised using two cut-offs for severe obesity: zBMI>2.58 and zBMI>3.5.3
Blood pressure
BP was measured after 20 min seated rest using an automated machine (Philiips IntelliVue MP30 Monitor, Koninklijke Phillips N.V., Holland). BP was taken at the right arm three times serially, with the third value recorded. Systolic and diastolic BP were converted to z-scores using LMSgrowth program V.2.69 (Harlow Healthcare), which uses the UK BP population data.43 44 Hypertension was defined as either systolic or diastolic BP >98th centile (2 SD above the mean).3
Blood parameters
Blood was drawn following a 10–12 hours fast. Bloods were analysed for cholesterol (including high-density lipoprotein (HDL)), triglycerides, glucose, % glycated haemoglobin, insulin and alanine aminotransferase (ALT). Blood was processed at Great Ormond Street Hospital laboratory. Homeostatic model assessment-insulin resistance (HOMA-IR) was derived using formula (insulinxglucose/2). Abnormality flags were generated for individual blood variables using cut-offs based on a UK consensus statement,3 as follows: ‘abnormal HOMA-IR’ >4.4, ‘raised insulin’ for insulin levels above values based on pubertal stage (>10 mU/L prepuberty/early puberty, >30 mU/L mid-puberty, >20 mU/L late and complete puberty), ‘low HDL’ 0.9 mmol/L, ‘raised triglycerides' >1.47 mmol/L, ‘raised cholesterol’ >5.2 mmol/L, ‘abnormal HDL/C ratio’ >4.3.
Measurement of PWV
Patients in a fasted state rested for 30 min prior to measurement at room temperature, supine. Pulse waves were measured at the carotid and radial pulses using tonometry and appropriate software (SphygmoCor, AtCor Medical, Sydney, Australia) by a single operator for all participants. The distance between the carotid and sternal notch, and the sternal notch to the radial point (via the mid-shoulder) were also measured, and combined with waveforms and peripheral BPs (as above) by software to derive carotid-radial PWV values. Data were recorded only once per participant, and only recorded readings met quality control measures according to the manufacturer’s protocol (SD of derived PWV<10% of the PWV value, all PWV wave forms within window and timing SD<6%).
Analysis
Data were managed and analysed using Stata V.13 (StataCorp, Texas, USA). Data were cleaned and individual variables examined for normality. Participant characteristics were described using mean and SD for normally distributed continuous variables, and median and IQR otherwise. Group means were compared using t-test or χ2 test for normally distributed variables, and non-parametric tests otherwise. Group proportions were compared using χ2 test. Associations of anthropometric, metabolic risk factors, demographic variables and PWV were investigated using linear regression. Individual variables found to be associated with PWV at p<0.1 were entered into multivariable regression models. As zBMI, waist-z, FMI and SAD are recognised as proxies for adiposity (while also independently associated), each was entered into univariable and multivariable regression models discretely. Non-normally distributed continuous variables were transformed for use in univariable regression analysis. If the transformation did not alter the models significantly, models using non-transformed variables were presented. Effect sizes of models were described using coefficients of determination (R2 for univariable and multivariable models, with small, medium and large effects defined conventionally as R2>0.02, >0.13 and >0.26, respectively.45
Results
A total of 174 children were recruited to the HELP trial (65 (37%) male). Proportions in each ethnic group were: white 66 (38%), black 53 (30%), South Asian 36 (21%), mixed/other 19 (11%). Proportions at each pubertal stage were pre/early (Tanner 1/2) 21 (12%), mid (3/4) 38 (22%), late/post (5) 115 (66%). There were more females in complete/late puberty than in other stages (89% vs 12%, p<0.001). The sex ratio was similar in all ethnic groups. Fourteen (8%) participants were current smokers and 48 (29%) were either current or ex-smokers.
Characteristics of continuous variables for the study group are shown in table 1. Age was not normally distributed, but the sample appeared evenly distributed across age groups. Males were taller than females but similar in height z-score, while females had greater waist-z and FMI. Males had greater metabolic markers as triglycerides, fasting glucose and ALT; 126 participants (72%) had zBMI>2.5 and 17 (10%) exceeded 3.5.
Summary of continuous variables by sex
Metabolic risk factors
No participants had systolic hypertension or evidence of impaired fasting glucose. Four (2%) had diastolic hypertension, 35 (20%) raised HOMA, 34 (20%) raised insulin for pubertal stage, 29 (17%) elevated cholesterol, 29 (17%) raised triglycerides, 20 (12%) low HDL and 66 (39%) had an elevated HDL/C ratio.
Pulse wave analysis
Pulse wave data were available for 146 (84%) participants. Univariable regression analyses between PWV and anthropometric, cardiometabolic and demographic markers are shown in table 2. Significant positive associations were found between PWV and age, all adiposity markers (zBMI, FMI, waist-z and SAD), and abnormal triglyceride grouping (effects sizes were however small, R2=0.05, 0.04, 0.03, 0.03, 0.03, 0.02, respectively). Ethnic South Asians, and to a lesser extent blacks, had higher PWV compared with ethnic whites. PWV was lower in the low HDL group. Abnormal triglyceride grouping was no longer significant once adjusted for age, ethnicity and zBMI (data not shown). Low HDL grouping remained negatively associated with PWV when controlled for zBMI, age, ethnicity group (coefficient −0.60 (95% CI −1.17 to −0.03), beta −0.17, p=0.04, r2 0.17). There were no differences in PWV by sex, pubertal stage, smoking or cardiometabolic markers (including systolic and diastolic BP). Scatter plots of PWV versus measures of adiposity, with fitted regression lines, are shown in in figure 1. In general the associations are weak.

Scatter plot with fitted regression lines for measures of adiposity against pulse wave velocity (PWV) (m/s).
Univariable regression analyses of PWV on demographic, anthropometric and cardiometabolic variables
Multivariable regression models for each adiposity measure adjusting for age, ethnicity, abnormal triglycerides and abnormally low HDL are shown in table 3. There was a positive association between PWV and all adiposity measures except SAD. Effect sizes for adjusted models for each adiposity measure were medium in size (R2 in adjusted models for zBMI=0.16, waist-z=0.13 and FMI=0.15).
Multivariable analyses of pulse wave velocity on adiposity measures (adjusted for age, ethnicity, abnormal triglyceride and low HDL).
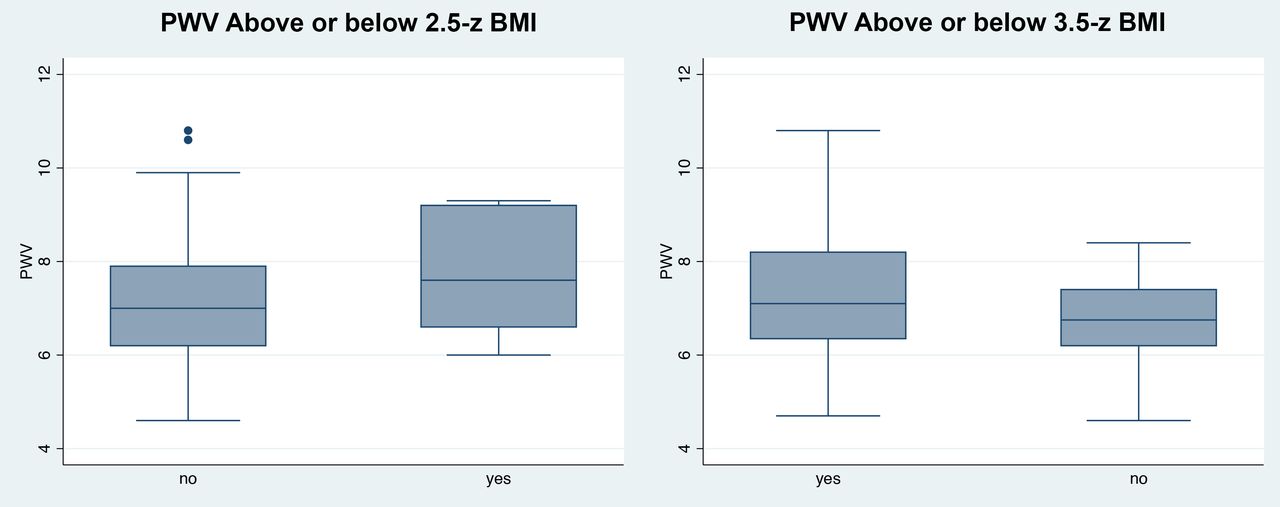
Participants with zBMI>2.5 SD and >3.5 SD had greater PWV on average than those below the cut-offs (>2.5 SD: 7.1 vs 6.8, p=0.04; >3.5 SD: 7.6 vs 7.0, p=0.03); however, the groups overlapped substantially (see figure 2).

Box plots of distribution of pulse wave velocity (PWV) (m/s) when grouped by presence or not of severe obesity (classified by >2.5 zBMI and >3.5 zBMI, respectively). Central lines are median PWV.
Discussion
In our study of adolescents with obesity from a community sample in the UK, we found a positive association between arterial stiffness and adiposity (zBMI, FMI) including central adiposity in the form of standardised waist circumference. This association was independent of age and ethnicity. Partitioning subjects by levels of zBMI showed small differences in mean PWV by group, a finding also recently reported elsewhere.46 However, it is likely that this merely reflects a positive relationship between zBMI and PWV, and there was considerable overlap of PWV between groups (seen most clearly in figure 2). Thus, our ability to classify and understand what constitutes ‘severe obesity’ from the perspective of contemporary pathological processes remains limited. These findings provide important information for clinicians, young people and their families to better understand long-term CVD risk of obesity within the community, but also in clinical settings.
Our study provides other novel findings. First, we found few associations between PWV and conventional markers of cardiometabolic risk, in particular standardised BP. This is in contrast to a recent study from North America where PWV was greater in children with obesity and hypertension compared with those with obesity alone.47 Although the prevalence of hypertension in our sample was low compared with other published samples of adolescents with obesity,8 9 48 the validity of non-ambulatory, isolated high BP readings recorded at single encounters that are frequently found in studies of PWV are unclear.49 There is also evidence that adiposity itself may be a driving influence on vasculature which leads to the development of hypertension.50–52 Combined with the evidence that conventional risk markers are often unstable across adolescence,15 our findings highlight the need for larger, longitudinal studies to better understand the differential relationships between adiposity, BP and arterial stiffening. We also found no association between PWV and stage of puberty, although PWV increased with age. Lack of knowledge about the effects of puberty on arterial stiffness has been identified as a key limitation of many published studies of PWV in children and adolescents with obesity.18 27 28 The relationship between puberty, obesity and arterial stiffening also needs larger, longitudinal samples, as puberty is associated with the development of sexual dimorphism in cardiovascular risk profiles that is not apparent earlier in childhood. Lastly, we found that South Asian adolescents had greater PWV compared with white, and our ability to describe differences in PWV between ethnicities typical of Northern European adolescent urban populations is we believe unique in the literature for the age group studied.
In our adjusted models, a 1 SD increase in BMI (ie, a unit increase in zBMI) was associated with an increase of 0.5 m/s in PWV, equivalent to an 0.4 SD change in PWV. For comparison, a meta-analysis of adult studies by Vlachopoulos et al 26 reported that a 1 SD increase in aortic PWV in adults led to around a 50% increase in total cardiovascular events and mortality. Similarly, Ben-Shlomo et al 25 reported HRs of 1.35 and 1.5 for coronary heart disease and stroke, respectively associated with a 1 SD increase in the log of aortic PWV. Our data were collected by carotid-radial rather than aortic methodology, nonetheless these adult data suggest that the level of increased arterial stiffening seen in our sample is concerning, particularly for those with more extreme BMI z-scores. Encouragingly, a recent meta-analysis in adults concluded that weight loss by lifestyle change appears to reduce PWV.53
Our study has a number of strengths and limitations. Our sample was drawn from community sources and is therefore more likely to be representative of the background population of CYP with obesity from which clinical samples come. Our sample had a representative spread across age groups. Data were collected using standardised operating procedures, and in particular one operator used a rigorous procedure for measurement of PWV in all participants, thus avoiding interoperator variability. Our protocols for measuring BP ensured ample resting time with no activity and reduced access to stress for participants and repeated measures were averaged; and moreover validity of high levels of BP found on individual encounters are unclear.49 Against that our data are cross-sectional and while they provide information on associations, they cannot be used to determine causality. There were incomplete data (15% of PWV). Our data come from an obesity intervention where sample size calculations were based on sufficient numbers to detect a difference between intervention and control, not for analysis of associations using cross-sectional data. Obtaining adequate power in cross-sectional studies using regression to detect small effect sizes is challenging for most studies, with a requirement for large numbers (n>400) for univariable analyses.54 Our sample size was sufficiently powered (using a conventional level of power at 0.8) to capture associations with large and medium effects for univariable analyses, but had a power of approximately 0.4 to identify associations with small effect sizes.54 It is therefore possible that our sample size may have been insufficient to capture associations with smaller effects sizes; and this is important given that the associations we found were all small in effect. While a single operator measured PWV in all cases and data was only recorded when it met manufacturer’s quality standards, only a single reading of PWV was performed per participant to avoid burden on participants, so repeated measures and analysis within individuals cannot be reported. Our measurement of PWV was also limited to the carotid-radial region (again chosen to avoid burden on participants with obesity within the main trial), and recent evidence suggests that PWV may vary by anatomical region.27 Puberty was self-assessed rather than directly rated, and disparities between trained observer and self-report of puberty have been reported.55 However, we reduced misclassification bias by combining genital/breast measures with pubic hair and with menstruation in females.
Conclusions
We have demonstrated that increasing adiposity is associated with greater PWV, a proxy for arterial stiffening, within a group of adolescents with obesity. This is concerning for the future CVD risk for a current generation with a high prevalence of obesity, and highlights the importance of research for successful interventions for obesity in young people. Caution must be exercised in interpreting the significance of conventional cardiometabolic markers such as hypertension and dyslipidemia, especially when considering pharmacological treatments for them. The long-term effect of changes in adiposity on PWV in adolescence remains unclear and larger, longitudinal studies are needed to investigate this further.
Acknowledgments
The data come from an adolescent obesity intervention funded separately to this work by the National Institute for Health Research, UK. The authors would like to thank the young people and their families who took part in the original study.
References
Footnotes
Contributors LH produced the first draft of the paper, co-conceived the study and collected the data. SK co-supervised the study and data collection, contributed to the final draft. IW co-supervised the study and data collection, contributed to the final draft. TJC assisted in the analysis and contributed to the final draft. JD co-supervised the data collection and contributed to the final draft. RV was main supervisor for the study, co-supervised the study and contributed to the final draft. All authors approved the final manuscript as submitted and agree to be accountable for all aspects of the work.
Competing interests None declared.
Ethics approval Central London Ethics Committee.
Provenance and peer review Not commissioned; externally peer reviewed.