Article Text

Abstract
Objectives To explore and compare the relationships between postmenstrual age (PMA), insulin, C-peptide and blood glucose concentrations (BGC) in hyperglycaemic and euglycaemic preterm neonates (PMA <30 weeks).
Design Observational.
Setting Dunedin Hospital Neonatal Intensive Care Unit, New Zealand.
Patients Preterm neonates were recruited and included nine insulin-treated hyperglycaemic and 20 euglycaemic neonates. Samples for euglycaemic neonates were obtained from leftover blood, and for insulin-treated neonates, additional blood was collected at the same time as the patients’ routine 4 hourly blood glucose test over a 24-hour period (six samples).
Main outcome measures Blood samples were collected, plasma was analysed for insulin and C-peptide and was measured in temporal association with BGC.
Results The euglycaemic neonates had a mean PMA (SD) of 28 (1.4) weeks and the insulin-treated neonates had 25.5 (1.8) weeks. C-peptide plasma concentrations were significantly lower (p<0.01) in the insulin-treated hyperglycaemic neonates (51.7 (100) pmol/L; 200(208) pmol/L) indicating lower insulin production. Insulin plasma concentrations (r=−0.38), BGC (r=−0.38), C-peptide plasma concentrations (r=0.36) and insulin/C-peptide ratios (r=−0.49) were all significantly affected by PMA (p<0.01). As expected, insulin plasma concentrations were higher in the insulin-treated hyperglycaemic neonates (156 (161) pmol/L; 93.2 (63.1) pmol/L, p<0.01) confirming that intravenous exogenous insulin reached these neonates.
Conclusions This study demonstrates that preterm neonates exhibit insulin resistance, hyperglycaemic neonates have lower insulin production than euglycaemic neonates and treatment with exogenous insulin did not appear to suppress insulin production in these neonates.
- neonate
- hyperglycaemia
- insulin
- insulin resistance
This is an Open Access article distributed in accordance with the Creative Commons Attribution Non Commercial (CC BY-NC 4.0) license, which permits others to distribute, remix, adapt, build upon this work non-commercially, and license their derivative works on different terms, provided the original work is properly cited and the use is non-commercial. See: http://creativecommons.org/licenses/by-nc/4.0/
Statistics from Altmetric.com
What is already known on this topic?
Hyperglycaemia is common in extremely premature neonates and is associated with increased morbidity and mortality.
Insulin resistance is likely to play an important causative role.
In addition, it is thought that hyperglycaemia is also a consequence of relative insulin deficiency.
What this study hopes to add?
This study confirms that hyperglycaemia in preterm neonates occurs in the presence of either insulin resistance and/or insulin deficiency.
C-peptide concentrations were significantly lower in the hyperglycaemic neonates indicating lower insulin production.
Treatment with exogenous insulin did not appear to suppress insulin production in these neonates.
Introduction
Hyperglycaemia is common in extremely premature neonates (gestation <28 weeks), and when birth weight is less than 1000 g, the estimated incidence is over 50%.1 A mean blood glucose ≥10 mmol/L (180 mg/dL) in the first 3 days of age is associated with a 15-fold increase in risk of mortality, and in the first 7 days, an increase of 30 fold.2 Persistent hyperglycaemia is associated with increased risk of infection and necrotising enterocolitis. It is not known if this increase in morbidity and mortality is a consequence of stress from severe illness, or if there is a direct causal relationship.3
The aetiology of this hyperglycaemia appears to be multifactorial and may include insulin resistance, decreased insulin production and immature control of gluconeogenesis.4 In the absence of hyperglycaemia, insulin and C-peptide concentrations are elevated in very preterm infants and decrease to term, suggesting that insulin sensitivity improves with maturity.5 In a population of hyperglycaemic premature infants, half of whom had received concomitant glucocorticoid treatment, there was both impaired pancreatic β-cell secretion and also relative resistance to insulin; proinsulin concentrations were elevated, suggesting defective processing of proinsulin to mature insulin.6 The expected decrease in glucose production in response to insulin is less pronounced in preterm neonates.7 8 In preterm neonates, the sensitivity and hepatocyte reaction to changes in glucose and insulin concentrations is limited due to immature processing of insulin with an elevated GLUT-1/GLUT-2 ratio in tissue.9 It is believed that preterm neonates are not able to suppress glucose production within a large range of glucose and insulin concentrations. Despite this, insulin infusion stabilised plasma glucose concentrations and allowed for the provision of calories in extremely premature neonates indicating the advantage of insulin in premature neonates who are not hyperglycaemic.10
However, it is not clear to what extent previous observations of insulin resistance and decreased insulin production in hyperglycaemic neonates were altered by concomitant glucocorticoid treatment.6 The aims of this study were to investigate in a population of neonates that were not currently exposed to exogenous corticosteroids:
differences in blood glucose, insulin and C-peptide concentrations between hyperglycaemic preterm neonates and euglycaemic preterm neonates;
the relationships between postmenstrual age (PMA), insulin, C-peptide and blood glucose concentrations in hyperglycaemic preterm neonates.
Patients and methods
Study population and design
The participants recruited into the study were hyperglycaemic and euglycaemic preterm neonates admitted into the Dunedin Hospital Neonatal Intensive Care Unit (NICU) from January 2011 to November 2012. This study consisted of two cohorts, an insulin-treated hyperglycaemic cohort and an age-matched (PMA less than 30 weeks) non-insulin-treated euglycaemic (ie, were not hypoglycaemic or hyperglycaemic) cohort. For the purpose of this study, euglycaemia was defined to be any neonate not requiring treatment for either hypoglycaemia or hyperglycaemia. A ratio of 2:1 of non-treated to treated was chosen to minimise bias and maximise the power of the study. Additionally, two neonates developed hyperglycaemia during their time in the study, and they had samples taken before and during insulin treatment and were considered separately as case studies for comparison with the two cohorts.
Data were collected from clinical notes for gestational age (GA), age, birth weight, current weight, birth length, birth head circumference, oral intake and intravenous fluids at time of samples. PMA was calculated for each neonate by correcting GA for the age at the time of the study (PMA=GA at birth+age from birth).
The insulin-treated neonates were included if they were hyperglycaemic, had a birth weight of <1500 g, GA at birth of <32 weeks, required insulin infusion as part of NICU protocol (blood glucose >10 mmol/L at two consecutive readings, 4 hours apart) and written informed consent from parents had been obtained. The exclusion criteria were neonates with: any suspected metabolic disorder or endocrine disorder that could interfere with glucose homeostasis including diabetic mothers, suspected growth hormone deficiency or maternal hyperthyroidism; any medications both maternal or infant that could interfere with glucose homeostasis including exogenous steroids, oral hyperglycaemic agents or diazoxide. Insulin treatment was administered below the filter of the IV line of these neonates, therefore insulin did not pass through a filter. Additional blood (150 µL) was collected into a tube at the same time as the patients’ routine 4 hourly blood glucose test. Each patient was monitored over 24 hours which resulted in six plasma samples for analysis. When each blood sample was collected the sample time, time and volume of last feed, blood glucose concentration and insulin dose were recorded.
The non-insulin-treated neonates were included if they were euglycaemic (ie, were not hypoglycaemic or hyperglycaemic), were undergoing blood tests as part of normal management and written informed consent from parents had been obtained. The exclusion criteria were: hyperglycaemia (blood glucose >10 mmol/L at two consecutive readings that were 4 hours apart), hypoglycaemia (blood glucose <2.6 mmol/L) or treatment with insulin, oral hypoglycaemic agents or other medicines that alter glucose homeostasis including corticosteroids. Plasma samples were obtained from left over blood samples taken during routine clinical care.
Therefore, the main difference in the inclusion and exclusion criteria of the two groups was the different BGC concentrations.
Ethical approval was obtained from the Lower South Regional Ethics Committee, New Zealand (approval number: LRS/10/06/017).
Materials and laboratory analyses
All blood samples were analysed for plasma insulin and C-peptide. Insulin was analysed using insulin chemiluminescent IV2-101 (Invitron, Monmouth, UK) kits (range: 1.2–1500 pmol/L, specificity: insulin 100%, proinsulin 1.2%, C-peptide 0%). C-peptide was analysed with C-peptide chemiluminescent IV2-004 (Invitron) kits (range: 5–5000 pmol/L, specificity: C-Peptide 100%, insulin 0%, proinsulin 2.0%). The chemiluminescence detection reagent kit IV1-001 used to to trigger the chemiluminescence reaction of the above kits (detection reagent 1: 0.5% hydrogen peroxide, 0.1M nitric acid, detection reagent 2: 0.25M sodium hydroxide, 0.2% surfactant) was also obtained from Invitron. A BMG LABTECH, POLARstar Omega microplate reader was used for chemiluminescent measurement. Blood glucose was measured with a Roche Cobas 8000 c702 analyser.
Data analysis
Statistical analyses were performed using Stata/IC (V.11.2). The data were analysed using summary statistics and frequency distributions, pairwise correlations and t-tests. Where the data were log-normally distributed, the hypothesis tests were performed on log-transformed data. Pairwise correlations were performed to explore the relationships between PMA and insulin/C-peptide (I/CP) or insulin/blood glucose concentration (I/BGC) in the insulin-treated group. GA, PMA, birth weight , current weight, length and head circumference were all highly correlated with each other (r>0.75) and could therefore not be included in the same statistical models. PMA was chosen as the main demographic for comparison as it produced the highest correlation coefficients with I/CP and I/BGC.5 As the concentration data were log-normally distributed, ln-transformed data were used (except for BGC, which was normally distributed).
Results
There were 20 non-insulin treated neonates and nine insulin-treated neonates. The non-insulin treated neonates contained 15 males and 5 females. The insulin-treated group contained three males and six females. Insulin-treated neonates were significantly more premature (lower GA and lower weight (birth and current)) than non-insulin treated neonates (table 1).
Subject demographics for neonates included in the study
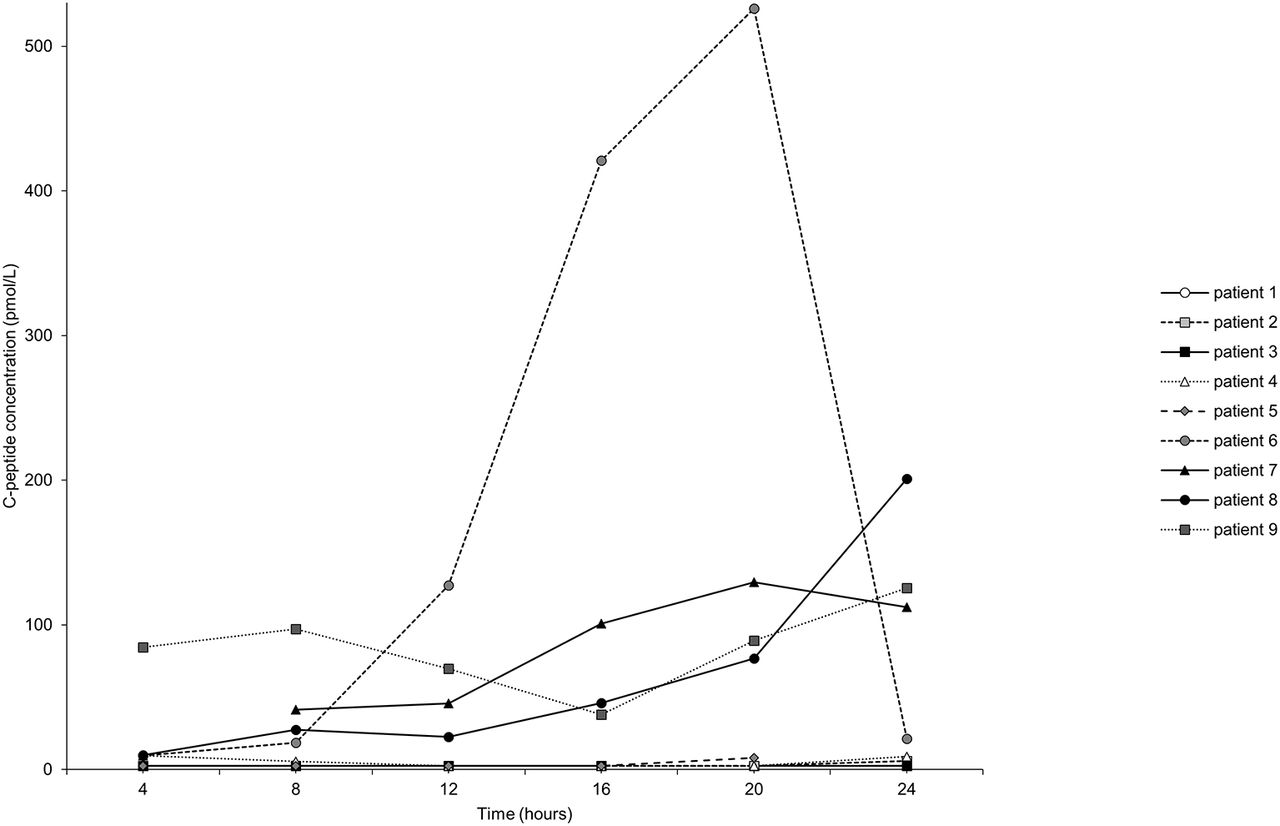
Of the insulin-treated neonates, five neonates had very low (2.5–9.63 pmol/L) C-peptide plasma concentrations and four neonates had comparatively high (9.97–526 pmol/L) plasma concentrations of C-peptide (figure 1). Figure 2 shows an example of the plasma concentration profiles of one neonate from the high C-peptide group.

C-peptide plasma concentrations of nine hyperglycaemic neonates treated with insulin over 24 hours. Time=0 at time of enrolment, first sample taken at 4 hours.

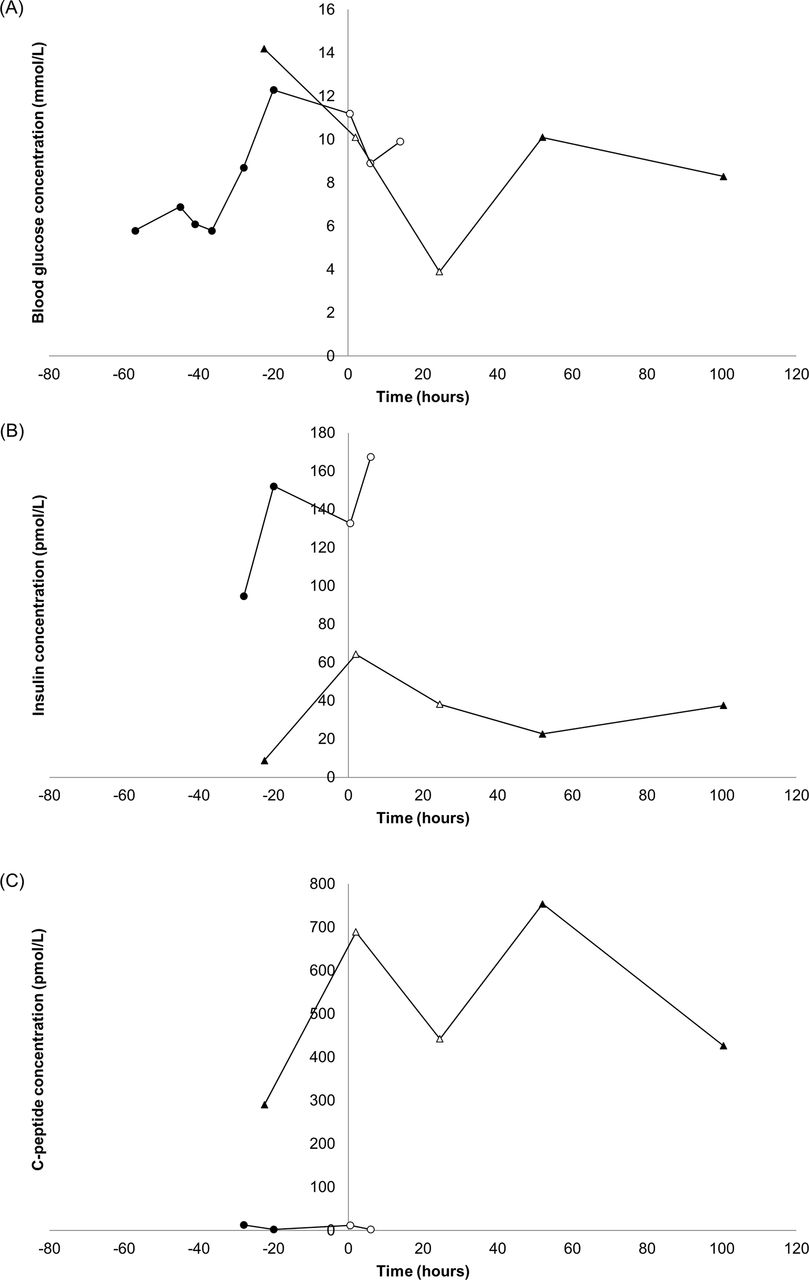
Blood glucose, insulin and C-peptide concentrations (A), insulin dose received and BGC (B) for one neonate treated with insulin over 24 hours.
Insulin plasma concentration (r=−0.38, p<0.01) and blood glucose (r=−0.38, p<0.01) were negatively correlated, and C-peptide plasma concentration was positively correlated (r=0.36, p<0.01) with increasing PMA (figure 3). The I/CP ratio was significantly affected by PMA (r=−0.49, p<0.01, figure 3); however, I/BGC was not (r=−0.22, p>0.05).
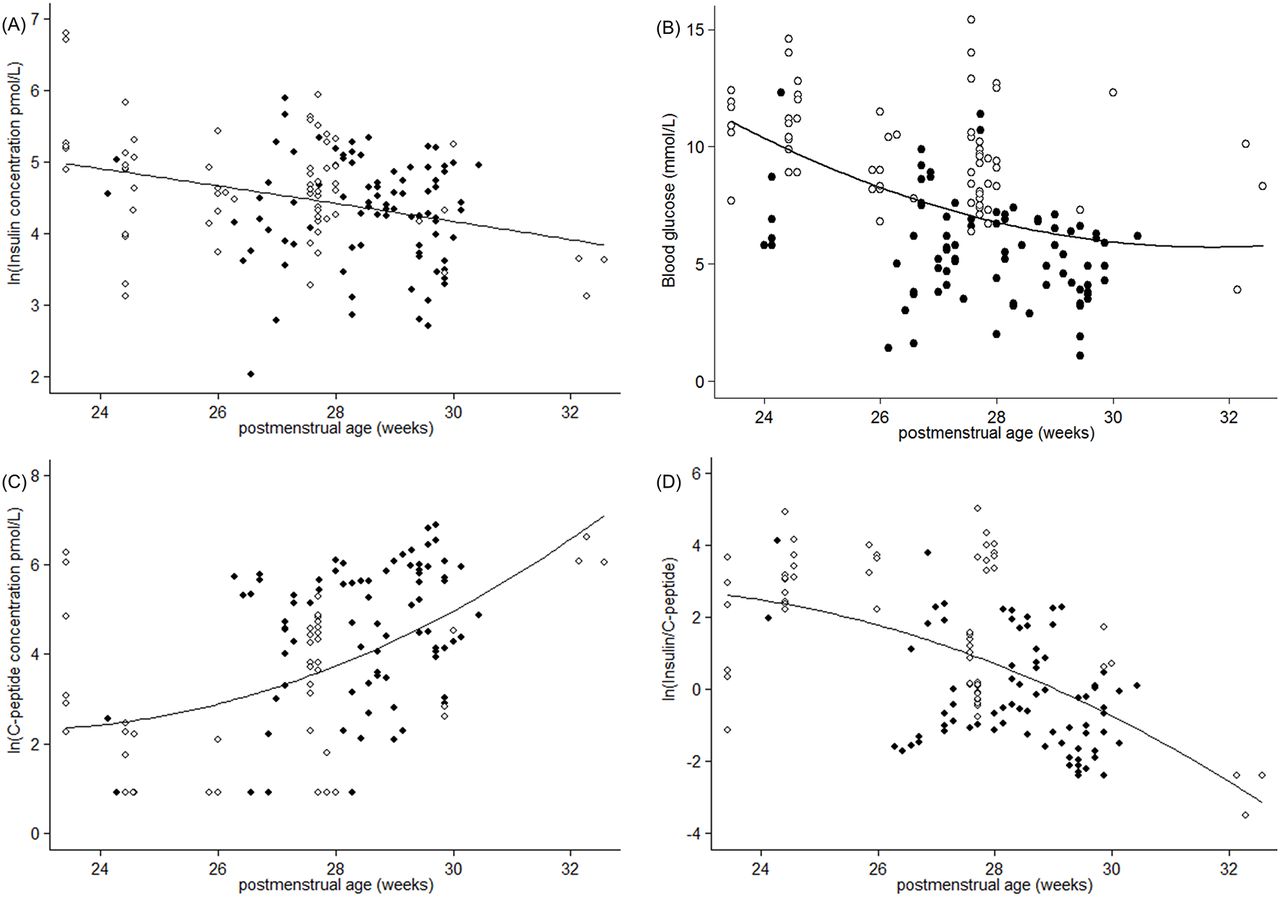
Scatter plots of (A): ln(insulin) versus PMA (r=−0.38 in insulin-treated neonates), (B): BGC versus PMA (r=−0.49 in insulin-treated neonates), (C): ln(C-peptide) versus PMA (r=0.36 in insulin-treated neonates), (D): ln(I/CP) versus PMA (r=−0.49 in insulin-treated neonates) in non-insulin treated neonates (●) and insulin-treated neonates (○).
Plasma insulin concentrations, blood glucose concentrations and I/CP ratios were significantly higher in the insulin-treated neonates than in the non-insulin treated group (p<0.0001, table 2). Plasma C-peptide concentrations were lower in the insulin-treated neonates than in the non-insulin treated group (p<0.0001, table 2).
Concentrations of glucose regulatory hormones by treatment groups
Of the two case study neonates, one neonate had high C-peptide plasma concentrations (290–754 pmol/L), while the other had low C-peptide plasma concentrations (2.50–13.0 pmol/L). The C-peptide plasma concentrations did not appear to be affected by the commencement of insulin treatment in either neonate (figure 4). Patient 1 had much higher I/CP ratios and slightly higher I/BGC ratios than patient 2. Patient 1 was 1 day old at the start of this study (PMA 24 weeks), whereas patient 2 was 1 month old (PMA 32 weeks) at the time of the study (table 3).
Two patients (patient 1 (●) and patient 2 (▲)) before and during insulin treatment: blood glucose concentration (A), insulin plasma concentration (B) and C-peptide plasma concentration versus time. Filled symbols are concentrations when not receiving insulin treatment, and open symbols are concentrations during insulin treatment. Insulin treatment was started time 0.
Subject demographics for neonates included in the study with the neonates from the case study identified
Discussion
The main findings of this study are that insulin production is lower with increasing prematurity; exogenous insulin does not appear to suppress endogenous insulin in hyperglycaemic neonates and that insulin resistance and decreased insulin production may be present separately in hyperglycaemic neonates. The results of this study support the conclusion by Mitanchez-Mokhtari et al 6 that both defective processing of proinsulin in the pancreatic β-cells and insulin resistance are likely to be responsible for altered glucose homeostasis in hyperglycaemic neonates. These two factors may be present separately, and hyperglycaemic neonates may have both defective processing of insulin and insulin resistance or just one of these factors.
Fasting insulin, homeostasis model assessment, I/BGC ratio and the Bennett index have all been used to predict insulin sensitivity.11 However, in neonates, it is impractical to measure fasting values because of the risk of hypoglycaemia. Therefore, for this study, insulin resistance was determined by comparing insulin plasma concentrations, blood glucose concentrations, C-peptide plasma concentrations and I/CP ratios with PMA in both groups.
Preterm neonates have been shown to exhibit insulin resistance in the absence of hyperglycaemia.5 In a previous study, insulin and C-peptide concentrations were elevated in very preterm infants and decreased to term, and this relationship persisted when blood glucose concentrations were accounted for.5 Insulin resistance is most pronounced in extremely premature neonates but reduces with increased gestation as shown by a change in I/CP at around 34 weeks.5 The significant effect of PMA on insulin plasma concentrations, blood glucose concentrations, C-peptide plasma concentrations and I/CP ratios in this study indicates that hyperglycaemic neonates may also exhibit insulin resistance as a direct result to their prematurity.
C-peptide plasma concentrations were significantly lower in hyperglycaemic neonates than in similar PMA euglycaemic neonates indicating lower insulin production in hyperglycaemic neonates both prior to and during treatment. Insulin plasma concentrations, blood glucose concentrations, C-peptide plasma concentrations and I/CP ratios were all significantly affected by PMA (p<0.01) in the hyperglycaemic neonates. This same effect was seen in the non-insulin treated neonates indicating that all the neonates whether hyperglycaemic or not showed insulin resistance and confirming the insulin resistance is a direct result of prematurity.
This study showed that C-peptide plasma concentrations in hyperglycaemic neonates increased with increasing PMA (figure 2) and were significantly lower than the concentrations found in euglycaemic neonates less than 30 weeks PMA (table 2). The lower C-peptide plasma concentrations in the hyperglycaemic neonates are consistent with either suppression of insulin production when exogenous insulin is administered or that hyperglycaemic neonates produce less insulin indicating insulin deficiency. The case studies of two neonates who were initially euglycaemic but became hyperglycaemic gave evidence to support the latter (ie, insulin deficiency) as the C-peptide plasma concentrations did not decrease in these neonates with the introduction of insulin treatment (figure 4). The hyperglycaemic neonates showed no apparent decrease in C-peptide plasma concentrations with increasing insulin dose, which is supported by the case study findings (figure 2). Since C-peptide plasma concentrations did not appear to decrease, the significantly higher I/CP ratios in the insulin-treated neonates are most likely due to an increase in insulin plasma concentrations as a direct result of insulin therapy. The I/CP ratio gives an indication of insulin clearance and in normal healthy adults does not exceed 1.0 unless the patient is receiving exogenous insulin or has liver cirrhosis.12 13
Although all the hyperglycaemic neonates in this study had lower insulin production than euglycaemic neonates, the hyperglycaemic neonates can be divided into two groups: those with very low insulin production (low C-peptide and comparatively lower insulin plasma concentrations) and those with higher insulin production (figure 1). This confirms the work of Meetze et al,4 which showed the same division into insulin-deficient and insulin-resistant infants. Three out of the five neonates in the low insulin production group had insulin plasma concentrations and exogenous doses that followed similar profiles related to their BGC, whereas two did not. This could indicate that three out of the five neonates in this group responded as expected to insulin treatment. All four of the higher insulin production group show similar profiles of insulin and C-peptide plasma concentrations with exogenous insulin dose that were directly related to BGC showing good response to insulin treatment with no apparent insulin suppression. The plasma concentration profiles of one neonate from the higher insulin production group as an example can be seen in figure 2. The significant effect of PMA on insulin concentrations, blood glucose concentrations, C-peptide concentrations and I/CP ratios indicate that hyperglycaemic neonates may exhibit insulin resistance as a direct consequence of their prematurity.
The main limitation of the present study is the paucity of data from hyperglycaemic neonates prior to the initiation of exogenous insulin treatment. This occurred because the insulin-treated participants were recruited once hyperglycaemia had been diagnosed. The lack of samples prior to patients starting insulin treatment and possibly after treatment limits the ability to determine the exact contributors to hyperglycaemia in these neonates. Since there were only two case study neonates, it is difficult to determine if low insulin production is the sole cause of hyperglycaemia in these neonates. The two groups of hyperglycaemic neonates described by Meetze et al 4 may help explain why Mitanchez-Mokhtari et al 6 found a significant decrease in C-peptide concentrations with insulin infusion, which was not found in the present study. However, as all the neonates in the present study showed no sign of insulin suppression either with the introduction of insulin treatment (case study neonates) or an increase in insulin dose (hyperglycaemic neonates), it is reasonable to conclude that suppression of insulin secretion did not occur in these neonates. Another limitation of this study is that the euglycaemic neonates did not have samples taken at regular intervals due to the opportunistic nature of sample collection. However, none of the neonates in this study showed any sign of illness such as sepsis that would affect the results, and blood that was taken for culture remained sterile in all neonates. There was also a significant difference in the prematurity of the hyperglycaemic neonates with the age-matched neonates. This probably not unexpected as more premature neonates are more likely to develop hyperglycaemia. However, we have demonstrated that similar effects were seen in the two groups indicating that insulin resistance is a direct result of prematurity, so for this study the difference in the prematurity of the two groups should not drastically affect the results.
A particular strength of the present study is that none of the neonates received glucocorticoid treatment. This is an important strength over previous studies, such as the study by Mitanchez-Mokhtari et al,6 because it would be expected that preterm neonates would have altered glucose homeostasis due to glucocorticoids.14 Glucocorticoid treatment would be expected to cause a rise in blood glucose concentration and insulin resistance. Additional strengths of the present study are the minimal blood sample size of 150 µL and the collection of six samples over 24 hours providing a rich data set for the hyperglycaemic neonates.
Conclusions
This study demonstrates that: preterm neonates exhibit insulin resistance; C-peptide plasma concentrations were significantly lower in the hyperglycaemic neonates indicating that hyperglycaemic neonates have lower insulin production than euglycaemic neonates; and treatment with exogenous insulin did not suppress insulin production in these neonates. The significant effect of PMA on insulin and C-peptide plasma concentrations demonstrates that insulin resistance is a key factor in neonatal hyperglycaemia. These findings have significant implications in designing insulin treatment regimens for preterm neonates.
Acknowledgments
We would like to thank the staff at Dunedin Hospital NICU for recruitment of study participants, and the study participants and their families.
References
Footnotes
Contributors ERS: substantial contribution to conception and design, acquisition of data, analysis and interpretation of data, drafted the initial manuscript and approved the final manuscript as submitted. DMR: substantial contribution to conception and design, supervised data collection, analysis and interpretation of data, reviewed and revised the manuscript and approved the final manuscript as submitted. BJW: substantial contribution to conception and design, supervised data collection, critically reviewed the manuscript and approved the final manuscript as submitted. RSB: substantial contribution to conception and design, supervised data collection, critically reviewed the manuscript and approved the final manuscript as submitted. NJM: substantial contribution to conception and design, analysis and interpretation of data, reviewed and revised the manuscript and approved the final manuscript as submitted.
Funding The School of Pharmacy, University of Otago for a PhD stipend for ERS. New Zealand Pharmacy Education and Research Foundation (NZPERF) for funding of the assay kits.
Competing interests None declared.
Patient consent Parental/guardian consent obtained.
Ethics approval Lower South Regional Ethics Committee, New Zealand.
Provenance and peer review Not commissioned; externally peer reviewed.