Article Text

Abstract
Objective To establish the incidence of road transport collision (RTC) fatalities in the Irish paediatric population, examining trends in fatality rates over a period of 25 years, during which several national road safety interventions were implemented.
Study design Retrospective review of death registration details of children 0–19 years in Ireland between January 1991 and December 2015. Trends in mortality rates were investigated using average annual per cent change and Poisson regression analysis.
Results Proportionate RTC mortality, the majority of which occurred on public roads (94.1%, n=1432) increased with age; <0.3% (<1 year), 8.3% (1–14 years) and 18.4% (15–19 years) (2011–2015 average). Over time, rates declined significantly in all age groups; reductions of 79.0% (4.0 to 0.84/100 000, 1–14 years) and 68.4% (15.5 to 4.9/100 000, 15–19 years) resulted in 537 (95% CI 515 to 566) fewer child deaths (1–19 years) over the period 1996–2015. This reduction was evident for both road user types, the greatest decline (84.8%) among pedestrians 1–14 years (2.1 to 0.32/100 000) and the lowest (66.5%) among occupants 15–19 years, the majority of whom were male (12.4 to 4.2/100 000). The rate of decline was greatest during periods coinciding with introduction of targeted interventions. Risk of death in children 1–14 years was halved in the period after 2002 (incidence rate ratio (IRR) 0.52) while in children 15–19 years old, a significantly lower RTC fatality risk was evident after 2006 and 2010 (IRR 0.68 and IRR 0.50).
Conclusion Child and adolescent mortality from RTCs has declined dramatically in Ireland, in excess of reductions in overall paediatric mortality. However, rates remain higher than in other EU countries and further effort is required to reduce the number of deaths further, particularly among adolescent males.
- epidemiology
- injury prevention
- data collection
This is an open access article distributed in accordance with the Creative Commons Attribution Non Commercial (CC BY-NC 4.0) license, which permits others to distribute, remix, adapt, build upon this work non-commercially, and license their derivative works on different terms, provided the original work is properly cited, appropriate credit is given, any changes made indicated, and the use is non-commercial. See: http://creativecommons.org/licenses/by-nc/4.0/.
Statistics from Altmetric.com
What is already known on this topic?
Road traffic collisions (RTCs) are a major cause of childhood death (1–14 years) annually throughout the EU and the primary cause of death among adolescents (15–19 years) globally.
Co-ordinated cross-sectoral road safety campaigns based on education, enforcement and engineering can lead to effective sustainable reductions in child and adolescent fatalities from transport collisions.
What this study hopes to add?
RTC fatality rates among Irish children have declined significantly since the introduction of targeted safety interventions, in excess of reductions in overall child mortality.
Incidence rates vary with age, gender and user type, being highest for male children 15–19 years, the majority of which were car occupants.
Risk of death in children 1–14 years was halved in the period after 2002 while in children 15–19 years old, a significantly lower RTC risk was evident after 2006.
Background
Road transport collisions (RTCs) are a major cause of childhood death (1–14 years) annually throughout the EU and the primary cause of death among adolescents (15–19 years) globally, despite being largely preventable.1–3 Following recent prioritisation on the global health agenda, child and adolescent fatalities from RTCs have declined in many countries, those adopting a child focused approach to intervention having the lowest rates worldwide.1 4–7 A multisectoral approach targeting human as well as mechanical factors, similar to the Swedish ‘Vision Zero’ initiative, has proven to be the most effective preventative strategy.8–10 In addition to fatalities, RTCs are a major cause of injury and long-term disability and an enormous drain on health resources; in Ireland, there are on average three serious injuries for each fatality with estimated costs higher than on average in the EU.6 7 11–13
In line with EU-wide initiatives, a number of national road safety strategies have been implemented in Ireland in an effort to address the death toll on the roads.14–16 However, there has been no separate target for reducing child fatalities, highlighted as an important risk group in Ireland.6 17
Complete, high-quality data on the nature and type of transport fatalities are required to have a full understanding of the causes and circumstances of such deaths in the paediatric population and to inform and evaluate public policy and intervention strategies. International comparison of data is complicated by variations in definitions and data collection methods, and incidence rates are often underestimated, particularly in relation to injuries.18 19 In Ireland, statistics on RTC fatalities are reported by the National Road Safety Authority, using a database compiled exclusively from official police records of RTC statistics for national roads.20 Alternatively, death registration information enables examination of all transport-related deaths, both traffic and non-traffic related, for the entire paediatric population. This complete data source can be readily compared with international data via standardised cause of death coding systems.21
The objectives of this study were to establish the incidence of RTC-related mortality in the Irish paediatric population (1–19 years), examining trends in incidence rates for age, gender and user type, over a period spanning 25 years (1991–2015) during which a series of legislative measures aimed at reducing road fatalities was implemented nationally. The information obtained from this analysis will add to the knowledge base available to those involved in formulation of public policy aimed at reducing RTC fatalities in children.
Methods
Data extraction and inclusion criteria
Registration details of all deaths in Ireland are forwarded from the General Registration Office to the Central Statistics Office (CSO) which collects and analyses vital statistics on behalf of the Minister for Health, and also conducts and manages the Census of the Population. Access to this data is via a publicly available anonymised database, Statbank (http://www.cso.ie/px/pxeirestat/statire/) and following direct application for access to research microdata files by health researchers who satisfy designated criteria. Principle variables included on the CSO mortality database are age, gender, place and cause of death of each decedent. Each registered death is attributed an underlying cause of death code, determined from the medical certificate of the cause of death and coding application rules of the WHO International Classification of Diseases (ICD-9 and ICD-10) system. The following details on all deaths (0–19 years) registered in Ireland during 1990–2015 were extracted from the CSO’s official statistics database;
Number of deaths in each age and gender category (all causes).
Number of fatalities due to RTCs for each age and gender, defined as those coded ICD-10 V01–V89 (2007–2015) and ICD-9 E810–E819 (Motor vehicle traffic accidents), E820–E825 (Motor vehicle non-traffic accidents) and E826–E829 (Other road vehicle accidents) for deaths registered prior to 2007.
Annual population estimates by age and gender (Census database).
Age categories were defined as follows: <1 year, 1–14 years and 15–19 years. For the purpose of this study, the term ‘paediatric’ is used to refer to all children aged 1–19 years and used interchangeably with ‘children’. Four national road safety strategies were implemented during the period studied.15 16 Important legislative changes incorporated in these strategies are summarised in table 1, based mainly on introduction and extension of a penalty/demerit points system (PPS).
Timeline of road safety legislation in Ireland
Statistical analysis
Crude rates for ‘all-cause’ and ‘RTC’-related deaths for populations 1–14 years and 15–19 years were expressed as aggregate (5-year) blocks in order to avoid disclosure issues and permit further analysis. Three-year averages were used to address potential fluctuations due to random variation. The pace of change in rates over time was expressed as the average annual per cent change (APC) for each 5-year block.22 Overall percentage change relative to baseline was estimated as follows:
((average rate 2011–2015)−(average rate 1991–1995)/(average rate 1991–1995))×100
Change in incidence over time was examined using Poisson regression analysis (with robust SEs and absence of overdispersion/underdispersion established). Timing of implementation of public health strategies aimed at reducing RTCs was considered; indicator variables marking periods before and after the introduction of specific interventions were created as binary before (0) and after (1) variables based on year of introduction—1993, 2002, 2006, 2010—and included in the regression model. Unadjusted incidence rate ratios (IRRs) relate to the cumulative effect of several interventions. Multivariable regression adjusting for the effect of other intervention points was used to identify the contribution of individual interventions on fatality rates over time. The significance threshold for p values was set at 0.05. Number of lives saved was estimated by subtracting actual from expected number of deaths had baseline rate not changed (where expected deaths=mortality rate of age group×population of age group).
Results
RTC mortality rates by age, gender and user type
A total of 1521 deaths in children and adolescents aged 0–19 years were registered in Ireland during 1991 to 2015 with ‘land transport collision’ as the certified cause of death. Of those, 1% (n=19) were aged <1 year, 34% (n=515) aged 1–14 years and 65% (n=987) aged 15–19 years. The overall gender distribution was 71.5% male (n=1088) and 28.5% female (n=433). The majority of fatalities were traffic related (94.1%, n=1432), 72.7% (n=1106) were vehicle occupants and 25.4% (n=386) pedestrians. Proportionate mortality due to transport collisions increased gradually with age; from 0.3% of infant mortality to 8.3% (39/468) of deaths in children 1–14 years old, and 18.4% (69/375) in children 15–19 years (table 2). Rates declined gradually in both age categories over time with an overall reduction of 79.0% for children 1–14 years; 0.84/100 000 (8 deaths/year) in 2011–2015 versus 4.0/100 000 (34 deaths/year) in 1991–1995. For children 15–19 years, the overall reduction was 68.4%; 15.5 deaths/100 000 (52 deaths/year) in period 1991–1995 versus 4.9 deaths/100 000 (14 deaths/year) in period 2011–2015. The per cent change in RTC rates was greater than for overall mortality for every 5-year block except for 1996–2000. The change in fatality rates after 1991–1995 is equivalent to 537 (95% CI 515 to 566) fewer deaths (1–19 years) in the period 1996–2015.
Trend in all-cause and road transport–related mortality rates among Irish children, 1991–2015
The reduction in RTC mortality is reflected in a corresponding pattern of decline in overall child mortality rates which dropped by 52.7% (1–14 years) and 44.0% (15–19 years). Infant mortality (all cause) also declined greatly while calculation of RTC rates was not appropriate due to small numbers.
Incidence rates were greater for males than females, the greatest M:F ratio among children 15–19 years and lessened over time (table 2, figure 1).

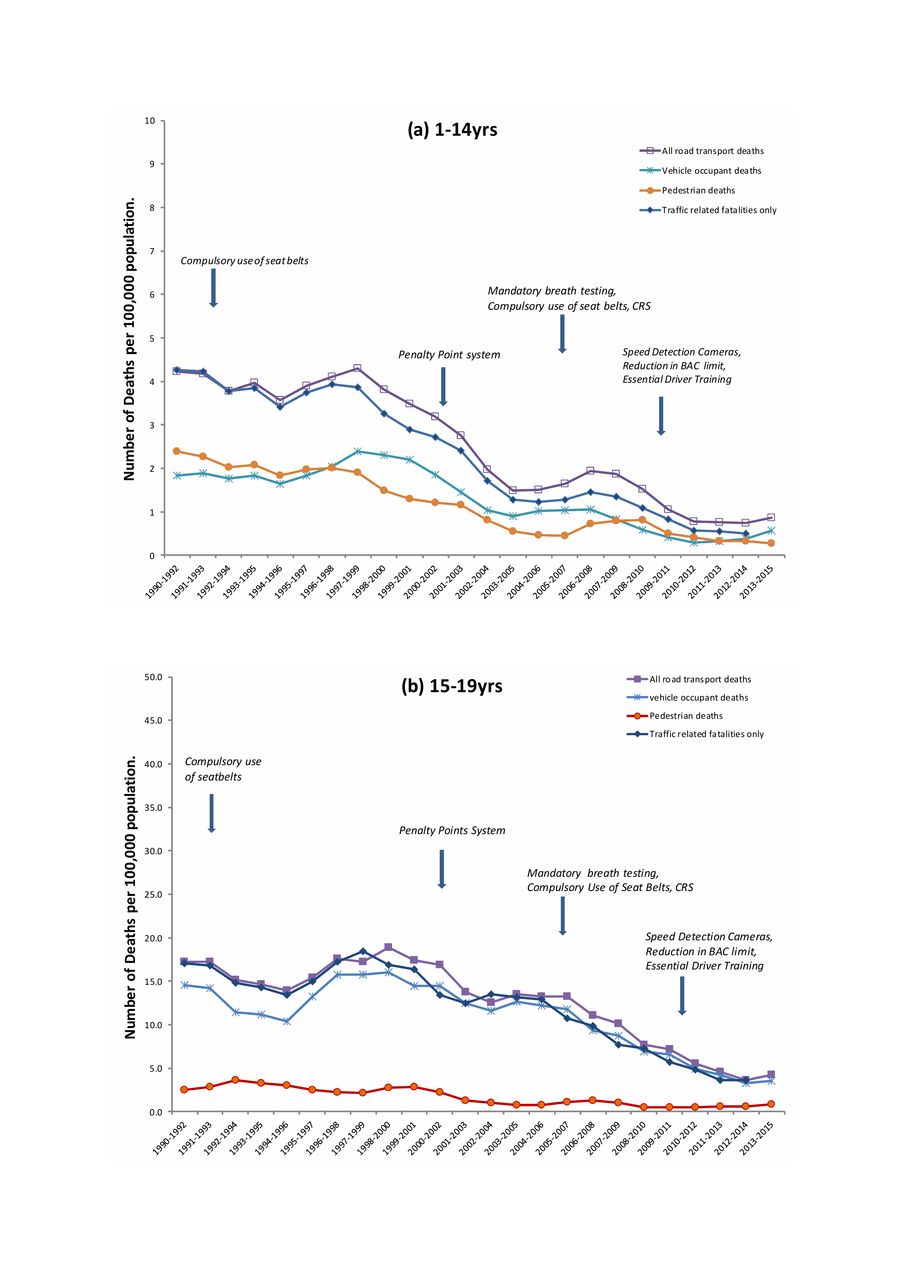
Annual trend in road transport collision fatalities in the populations (A) 1–14 years and (B) 15–19 years in Ireland 1990–2015 (3-year moving averages), subdivided by gender. BAC, blood alcohol concentration; CRS, child restraint systems.
Among children 1–14 years, a sharp continuous decline in rates occurred in the late 1990s/early 2000s whereas in children 15–19 years, the decline occurred later and more gradually (figure 1). Fatality rates for traffic only–related collisions (non-traffic deaths excluded) dropped by 84.1% over the duration of the study to an average rate of 0.6 deaths per 100 000 (n=6 deaths per year) in the age group 1–14 years and in 2011–2015 accounted for 74.3% of RTCs in comparison with 97.7% in 1991–1995. In the older age category, rates dropped by 67.7%, but the proportion of RTCs occurring on public roads remained at 89.9% (table 3). The reduction in rates was evident for both categories of road user, the overall pattern most closely reflected by vehicle occupants in both age categories (figure 2). Pedestrians accounted for between 52.9% and 38.5% of all RTC fatalities in children 1–14 years while the vast majority (80.2%–92.5%) in older children were vehicle occupants (table 3). Pedestrians aged 1–14 years exhibited the greatest decline in rates while the least decline occurred among vehicle occupants aged 15–19 years.

Annual trend in road transport collision fatalities in the populations (A) 1–14 years and (B) 15–19 years in Ireland 1990–2015 (3-year moving averages), subdivided by road user type. BAC, blood alcohol concentration; CRS, child restraint systems.
Road transport fatality rates by age and road user type
Average APC in mortality rates
In children 1–14 years, the rate of decline in transport fatalities was greatest during 2001–2005 (−17.6%) and 2006–2010 (−10.4%). A similar pattern of decline was observed for overall mortality except for period 1996–2000 (APC 0.04%). APCs for children 15–19 years were less than for those 1–14 years, indicating a slower decline in rates. The greatest rate of decline in transport fatality rates in this age group occurred in 2006–2010 with an average annual change of −12.0%. The decline in RTC fatalities is reflected in the gradual reduction in proportionate mortality rates; from 18.9% of total deaths in 1991–1995 to 8.3% in 2011–2015 (1–14 years) and from 32.3% to 18.4% (15–19 years) (table 2).
Regression analysis of RTC fatality rates by age, gender and user type
A significant decline in RTC mortality was evident for all ages over time (p<0.01) (table 4). Binary variables indicating points of intervention accounted for more variability in the regression model and were significant predictors of the rate of RTC mortality. Adjusted IRRs of 0.52 and 0.55 associated with intervention points 2002 and 2010, respectively, indicated a significantly lower risk of death in the group 1–14 years in subsequent years. An elevated risk (IRR 1.39, p<0.05) for the period following 1993 was not significant when other indicator variables were adjusted for in the model. Risk of RTC fatality was significantly lower for both pedestrians and occupants after 2002; IRR 0.49 and IRR 0.45, p<0.001. The lower risk indicated for the period after 2010 (IRR 0.55) was not significant for either group in isolation, possibly due to loss of statistical power (table 4).
Poisson regression analysis of RTC fatality rates by age and road user type
Among older children, risk of fatality was significantly lower in the periods after 2006 and 2010; IRR 0.68 (p<0.05) and 0.50 (p<0.01), respectively, and evident for vehicle occupants only. The non-significant risk (IRR 0.47, p=0.06) estimated for pedestrians in this case may be due to small numbers (n=2 per year).
Examination of IRRs by gender in children 1–14 years revealed females were at lower risk than males; IRR 0.29 versus IRR 0.61 (p<0.01). The reduced risk evident in the period following 2010 was significant for females only; IRR 0.48, p<0.05 (table 5). For male children 15–19 years, a significant reduction in risk was not evident until after 2010 while risk among females was significantly lower after 2006.
Poisson regression analysis of RTC fatality rates by age and gender
Discussion
Child fatalities from RTCs have declined significantly in Ireland since the early 1990s, contributing substantially to a large decline in overall child mortality. Large reductions in rates across all age, gender and user categories have resulted in 537 (95% CI 515 to 566) fewer child deaths in the 20-year period from 1996 to 2015. RTCs now account for 8.3% of all deaths in children 1–14 years, the equivalent of 8 deaths per year in comparison with 34 deaths/year in the early 1990s, while in older children this figure has dropped from 52 to 14 deaths/year. These results are based on analysis of death registration information for the entire paediatric population of Ireland, thus providing an accurate description of the incidence of RTC-related child mortality in this country. The dataset used has the advantage of being complete and is not subject to under-representation due to inclusion criteria relating to whether the incident occurred on a public or private road, or on systems errors relating to timing and/or transfer of information between data collectors and administrators. As this is a population-based study, potential confounding effects resulting from changes in ethnic composition of the population during this time are less pronounced than if the data related to a smaller geographical area.
The timing and pace of the observed decline in RTC deaths suggests that it may be attributed at least in part to a series of national intervention strategies and legislative changes. The first Government Road Safety Strategy launched in 1998 and outlined a number of specific targets and action programmes.15 However, a notable difference was evident in the timing and pace of decline suggesting varying effectiveness between age groups. The fastest rate of decline in younger children occurred during a period coinciding with introduction of the penalty point system in 2002 (the primary focus of which was speed reduction), prior to which the risk of death from RTCs was twice as high (IRR 0.52). A significantly lower risk was also evident after 2010, following legislation that enhanced the PPS and lowered the blood alcohol concentration threshold permissible to drive. However, among older children, the majority of whom were male occupants, risk of death did not drop significantly until after 2006. A greater risk of death from RTCs among older children is consistent with international data, and often attributed to inexperience and increased risk-taking behaviour by young male drivers, particularly when accompanied by peers, a possibility supported by narrowing of the gender gap as rate of fatalities declined.5 23 24 Analysis of a subset of this data indicated that the largest category of fatalities in this age category (at least 37%) were drivers (online supplementary table 1). Targeting driver behaviour is more difficult in this age group and the ineffectiveness of PPS legislation prior to 2006 may reflect insufficient levels of enforcement, as indicated by the low percentage of drivers issued points initially.24–28 New legislation in 2006 and 2010 which increased probability of testing/detection as well as the penalty for driving under the influence (mandatory disqualification) may have led to improvements in driver behaviour sufficiently to impact on rates. Similarly, no significant change in risk was evident in the initial period following introduction of legislation of compulsory seat belt use, despite strong evidence of a protective effect.29–31 After being listed as an offence in the PPS in 2003, however, and compulsory use of appropriate child restraint systems introduced in 2006, the rate of fatalities in the age group 1–14 years declined at a rate of 10.4% per annum.
Supplementary file 1
The observed decline in rates cannot be attributed solely to any specific intervention(s) and other influences on exposure risk require consideration. Data on traffic volume throughout this period show a persistent increase in both number of vehicles per head population as well as number of kilometres travelled.32 The economic downturn is reported to have influenced a lowering of RTC fatality rates in other jurisdictions; however, the fastest rates of decline in the Irish paediatric population occurred in the years prior to Ireland entering the recession in 2008.33 34 Furthermore, the earlier surge in population and immigration introduced new risk groups and the volume of cars and kilometres travelled on roads has increased (reportedly 16%). Along with austerity-induced reductions in spending on infrastructure and road maintenance, these factors would have influenced an increase rather than decrease in RTC risk.34 35 The large decline in pedestrian deaths in particular cannot be explained solely by introduction of the legislative changes described which focused mainly on driver behaviour and the main causative factors in RTCs, that is, seatbelt usage, speed and driving under the influence, which would have less influence on fatalities resulting from pedestrian error. This decline is likely to also be partly attributable to a change in exposure as evident in a gradual decline in the number of children walking, cycling and taking public transport to school (online supplementary tables 2 and 3). The decline in passenger fatality rates, which persisted despite a corresponding increase in numbers being driven in cars, suggests improvements in driver behaviour and supports a direct effect of road safety measures. Improvements in survival rates due to increased quality and access to prehospital services are another consideration, particularly with the advent of organised trauma care systems; however, declines in RTC-related serious injuries during the same period are consistent with a reduction in number of collisions rather than an increase in survival rates.13 20 36–38 Furthermore, 40% of RTCs in Ireland occur in rural areas, a factor which increases the risk of death because of longer response times leading to delayed medical attention. The potential impact of switching from ICD-9 to ICD-10 coding systems is a limitation of this study, but any effect is likely to be minimal since a similar pattern of decline occurred in ‘all cause’ mortality rates.39 40
It is impossible to comment on the mortality pattern that would have been observed had these interventions not been introduced; however, timing of the decline relative to the introduction of interventions combined with other factors favouring an increase rather than decrease in risk is supportive of a direct effect. This reduction in the number of deaths has narrowed the gap between Ireland and other countries with rates now on a par with the EU average (eight per million). However, this figure is twice that of the best-performing countries (UK, Norway, Sweden) demonstrating that there is room for further improvement.4 7 18 The variation in incidence and pattern of decline in fatalities between younger and older children highlights a need for more detailed analyses of the circumstances of RTC fatalities within different age groups, and factors specific to a child’s development that increase their vulnerability must be taken into account when developing intervention strategies. Additional detail relating to the type and nature of collisions is required to identify where future efforts must be directed to bring the rates in Ireland to the level of the best-achieving countries and eventually to zero.
Supplementary file 2
Supplementary file 3
Acknowledgments
We are grateful to the sstaff in the Central Statistics for their valuable assistance with provision of data on child mortality statistics. We are also thankful to Dr Tim Grant and Dr Myra O’Regan for advice and guidance on the statistical analysis and appropriate use and interpretation of the results. Thanks also to Sharon Heffernan of the Irish Road Safety Authority for providing information relating to the various intervention campaigns introduced during the study period. Finally, many thanks to Bernadette Colley in Temple Street Children’s University Hospital Library for her advice and assistance with literature searches.
References
Footnotes
Patient consent for publication Not required.
Contributors CM contributed to the study proposal and design, conducted the data analysis, interpreted the results and wrote the manuscript. AJN is the NPMR clinical lead, contributed to the study design and analysis and reviewed the manuscript. KH contributed to data collection and manuscript review. JD reviewed the manuscript.
Funding The authors have not declared a specific grant for this research from any funding agency in the public, commercial or not-for-profit sectors.
Competing interests None declared.
Provenance and peer review Not commissioned; externally peer reviewed.