Article Text

Abstract
Purpose To examine the three facial features of fetal alcohol syndrome (FAS) in a cohort of Australian Aboriginal children from two-dimensional digital facial photographs to: (1) assess intrarater and inter-rater reliability; (2) identify the racial norms with the best fit for this population; and (3) assess agreement with clinician direct measures.
Methods Photographs and clinical data for 106 Aboriginal children (aged 7.4–9.6 years) were sourced from the Lililwan Project. Fifty-eight per cent had a confirmed prenatal alcohol exposure and 13 (12%) met the Canadian 2005 criteria for FAS/partial FAS. Photographs were analysed using the FAS Facial Photographic Analysis Software to generate the mean PFL three-point ABC-Score, five-point lip and philtrum ranks and four-point face rank in accordance with the 4-Digit Diagnostic Code. Intrarater and inter-rater reliability of digital ratings was examined in two assessors. Caucasian or African American racial norms for PFL and lip thickness were assessed for best fit; and agreement between digital and direct measurement methods was assessed.
Results Reliability of digital measures was substantial within (kappa: 0.70–1.00) and between assessors (kappa: 0.64–0.89). Clinician and digital ratings showed moderate agreement (kappa: 0.47–0.58). Caucasian PFL norms and the African American Lip-Philtrum Guide 2 provided the best fit for this cohort.
Conclusion In an Aboriginal cohort with a high rate of FAS, assessment of facial dysmorphology using digital methods showed substantial inter- and intrarater reliability. Digital measurement of features has high reliability and until data are available from a larger population of Aboriginal children, the African American Lip-Philtrum Guide 2 and Caucasian (Strömland) PFL norms provide the best fit for Australian Aboriginal children.
- child
- fetal alcohol spectrum disorders
- face
- dysmorphology
- measurement
This is an Open Access article distributed in accordance with the Creative Commons Attribution Non Commercial (CC BY-NC 4.0) license, which permits others to distribute, remix, adapt, build upon this work non-commercially, and license their derivative works on different terms, provided the original work is properly cited and the use is non-commercial. See: http://creativecommons.org/licenses/by-nc/4.0/
Statistics from Altmetric.com
What is already known on this topic?
There are no validated normative data for assessing the fetal alcohol syndrome (FAS) facial phenotype in Australian Aboriginal cohorts.
The application of different PFL norms and Lip-Philtrum Guides in Australian Aboriginal children has not been examined.
Digital assessment of the FAS facial phenotype is more accurate than direct measures, but has not been examined in an Aboriginal cohort.
What this study hopes to add?
The African American Lip-Philtrum Guide and Caucasian (Strömland) PFL norms are the best fit for use in Australian Aboriginal children.
Digital assessment of the FAS facial phenotype in an Australian Aboriginal child population demonstrated substantial inter- and intra-rater reliability.
The agreement between direct and digital assessment methods was moderate.
Introduction
Fetal alcohol spectrum disorders (FASD) are associated with secondary problems including poor academic performance, unemployment, substance abuse and trouble with the law, which may be decreased by early diagnosis and intervention. Several guidelines exist for diagnosing FASD, including the Canadian guidelines,1 4-Digit Diagnostic Code (4-DDC),2 Centres for Disease Control and Prevention guidelines,3 Hoyme guidelines,4 and the Institute of Medicine FASD guidelines.5 Despite their differences, the guidelines are consistent in designating objective criteria (ranks and percentile cut-offs) for classifying the facial phenotype of fetal alcohol syndrome (FAS) or partial FAS (PFAS), namely: (1) short palpebral fissure length (PFL); (2) smooth philtrum; (3) thin upper lip.6
Examination of the facial phenotype has traditionally been performed using subjective gestalt methods and direct measurement, which may be inaccurate. For example, measuring PFL using a plastic ruler can result in differences ranging from 2 to 16 mm compared with using the ‘gold standard’ caliper method.7 Direct measures of PFL have also been found to be incorrect in 77% of patients7 when compared with measures obtained from two-dimensional (2D) digital images using the FAS Facial Photographic Analysis Software (FPA Software).8 Analysing PFL with the FAS FPA Software is as accurate as the caliper method7 but safer, and provides a permanent digital record. The software also allows measurement of upper lip thinness.
The specific lip-philtrum rank and PFL percentile cut-off criteria for classifying the FAS/PFAS facial phenotype relies on the availability of normative data. The 4-DDC provides two Lip-Philtrum Guides: Guide 1 for Caucasians and all races with similarly thinner upper lips; and Guide 2 for African Americans and all races with similarly thicker upper lips (http://depts.washington.edu/fasdpn/htmls/lip-philtrum-guides.htm).2 Hoyme et al recently introduced a South African (Cape coloured) Lip-Philtrum Guide and confirmed it was not appropriate for use with African Americans.9 Although it would seem intuitive that the most appropriate 4-DDC Lip-Philtrum Guide for an Australian Aboriginal population would be Guide 2, its use should be guided by empirical data.
In a population-based study with active case ascertainment in remote, Aboriginal communities of Western Australia (the Lililwan Project), the prevalence of FAS/PFAS in accordance with Canadian 2005 criteria10 was 12%, which is comparable to other high-risk groups internationally.11 In the Lililwan Project the Hall PFL charts were used12 (now replaced by the more accurate Canadian charts,13 which were not available at the time of protocol development11), and the African American Guide 2.2 The assessment of the facial phenotype in the Lililwan Project was undertaken by two trained study paediatricians using direct methods (clear plastic ruler for the PFL, and visual inspection using the Lip-Philtrum Guide 2). With reports of the superior accuracy of the FAS FPA Software compared with direct measurement methods, and with uncertainty about which Lip-Philtrum Guide or PFL normal growth chart is appropriate for an Australian Aboriginal population, the aims of this study were to:
Determine the intra-rater and inter-rater reliability of PFL, lip thinness and philtrum smoothness when assessed digitally using the FAS FPA Software;
Determine which racial norms (Caucasian or African American) provide the best fit for measurement of the PFL and lip thinness in an Australian Aboriginal population;
Assess the level of agreement between the rank of facial features when measured directly by the clinician and digitally from 2D facial photographs.
We hypothesised that the digital assessment method would have substantial inter- and intra-rater reliability. We also hypothesised that the African American Lip-Philtrum Guide 2would be more applicable to our Australian Aboriginal child cohort than the Caucasian Guide 1; and there would be moderate agreement in facial measures obtained by study clinicians and digital assessment.
Methods
Historical data and photographs from the Lililwan Project were used in this reliability and agreement study. Participants were born in 2002–2003 and resided in remote communities within Fitzroy Valley, WA in 2010–2011.14 The Lililwan Project involved a comprehensive multidisciplinary assessment of 108 children using a version of the 2005 Canadian FASD diagnostic guidelines,10 modified for use (through the selection of assessments less biased by culture and language) in remote Aboriginal communities.14
For the present study, we used photographs of children who: (1) had been assessed for FASD by a multidisciplinary team; (2) had digital face photographs in at least the frontal frame (frontal view was essential but three-quarter and lateral view photos were also collected if available); (3) had clinician-measured facial dysmorphology data; and (4) were Aboriginal (n=106).
Ethics approval for the study including the analysis of photographs was granted from The University of Sydney, the Western Australian Aboriginal Health Information Ethics Committee, the Western Australian Country Health Services Board Research Ethics Committee and the Kimberley Aboriginal Health Planning Forum Research Subcommittee.
Photograph analysis
As part of the Lililwan Project, each child had multiple facial photographs taken in three planes (frontal, three-quarter and lateral) using a digital camera by one of the two study paediatricians (EJE, JF). Photos were standardised in accordance with the FAS FPA Software with proper rotation and relaxed facial expression.8 From the multiple photos taken, the photographs displaying the palpebral fissures, upper lip and philtrum most clearly were selected for analysis. Philtrum smoothness is best judged from a three-quarter view photo (available for 101 children). For the frontal photographs, a 20 mm adhesive manuscript sticker was attached centrally between the eyebrows as an internal measure of scale to compute the PFL in millimetres.
As part of the current study, photographs were analysed using the FAS FPA Software (V.2.0.0, 2012).8 PFL was measured by clicking the mouse on the inner and outer point of each PFL and measuring the length of the internal measure of scale. The software computed the mean: (1) PFL (mm); (2) PFL Z-score based on which PFL normal growth chart for race was selected and (3) PFL ABC-Score (A: >-1 SD; B: >-2 SD and ≤−1 SD; C: ≤−2 SD). The software allows the User to select from a list of PFL normal growth charts for race. For the study, the Hall Caucasian,12 Canadian (Clarren Caucasian),15 Scandinavian (Strömland Caucasian)16 and African American17 PFL normal charts were used. Philtrum smoothness was ranked visually on a five-point scale based on the Lip-Philtrum Guide selected (Caucasian Guide 1 or African American Guide 2). The software converted the philtrum rank into a three-point Philtrum ABC-Score (A: Ranks 1 (very deep) and 2 (moderately deep), B: Rank 3 (normal), C: Ranks 4 (moderately smooth) and 5 (very smooth)). Upper lip thinness was measured by outlining the vermilion border of the upper lip with the mouse to compute circularity (perimeter2/area). Circularity is greater in thinner lips. Each Lip Rank on the five-point Lip-Philtrum Guides is defined by a range of circularities (eg, the Rank 4 moderately thin upper lip on the Caucasian Lip-Philtrum Guide 1 is defined by the circularity range 75.5–131.4. The Rank 4 lip on the African American Lip-Philtrum Guide 2 is defined by circularity range 52.1–62.0). The software converted lip circularity to lip rank based on the racial Lip-Philtrum Guide selected. The software then computed a three-point Lip ABC-Score (A: Ranks 1 (very thick) and 2 (moderately thick); B: Rank 3 (normal); C: Ranks 4 (moderately thin) and 5 (very thin)). Once the individual facial features were measured, the software generated two facial phenotype scores: (1) A Facial ABC-Score reflecting the concatenation of the PFL, philtrum and lip ABC-Scores (eg, the Facial ABC-Score of ‘CBA’ reflects: PFL ≤−2 SD, Rank 3 philtrum and Rank 1 or 2 lip); (2) The four-point Face Rank which is derived from the Facial ABC-Score in accordance with the conversion tables printed on the back of the 4-DDC Lip-Philtrum Guides (Rank 1 Absent: no FAS facial features; Rank 2 Mild: 1–2 features; Rank 3 Moderate: 2.5 of the three features; Rank 4 Severe: all 3 FAS facial features).2 The software generated a one-page photo analysis report documenting all of these facial measures.
Digital assessment was conducted by two assessors who had no prior experience with the FAS FPA Software. TWT (A2; a postdoctoral research fellow) studied the user manual and software, and established the methods used in this study before training ZL (A1; a medical student). Both assessors followed the same instructions. They were blinded to presence/absence of prenatal alcohol exposure (PAE), diagnosis, including FAS/PFAS diagnosis, and clinician-rated ‘Severity’ of the FAS facial phenotype (based on the Canadian 2005 guidelines10: Absent: 0 features, Mild: one feature; Moderate: two features; Severe: three features). The three features included PFL ≤ −2 SD, a thin upper lip (Rank 4 or 5) and a smooth philtrum (Rank 4 or 5). Prior to each photographic analysis session, assessors calibrated their lip-tracing technique by practising with the Lip Circularity Practice Tool available within the software, and did not commence analysis of the study photographs until their circularity scores matched the pictured score for each lip rank. The photographs were digitally assessed over a 3-week period.
Intra-rater and inter-rater reliability (n=30)
A subset of photographs from 30 children was analysed by both assessors in triplicate and random order. Photographs were analysed three times each to increase the assessors’ experience in the digital assessment procedures and minimise practice effects on results. The PFL ABC-Score, lip rank and philtrum rank were determined using the African American Lip-Philtrum Guide 2 and African American PFL chart.17
Based on each assessor’s lip circularity measurements, the two most consistent trials for each child were selected for the intra-rater reliability analysis. The latter of the chosen trials for each assessor was chosen for the inter-rater reliability analysis. Intra-rater and inter-rater reliability was determined using weighted kappa with quadratic weights and 95% CI for the three-point PFL ABC-Score; five-point Lip Rank and five-point Philtrum Rank. The n=30 sample size was considered sufficient to detect a kappa value of 0.90 at 80% power, assuming a null kappa value of 0.40 and an expected proportion of positive ratings (agreement) of 50%.18
Identification of most appropriate racial norms for use in Australian aboriginal populations (n=42)
In addition to the 30 participants analysed for the reliability task by both assessors, the photographs of the remaining 76 children (total n=106) were digitally assessed by one assessor (A1; once only). The software was requested to generate two Photo Reports on each child: one using the African American PFL norms17 and Lip-Philtrum Guide 2,2 and the other using the Caucasian PFL norms (Hall12) and Lip-Philtrum Guide 1.2 To maintain consistency in the measurements between the reports for each child, digital marker placement for lip circularity and PFL measurements were not altered between the generation of the African American and Caucasian photo analysis reports for each child. It is important to note that only lip thinness, not philtrum smoothness, differs between Lip-Philtrum Guides 1 and 2, hence the analyses pertained only to lip and PFL measures.
To determine which racial PFL normal growth chart (Hall, Strömland, Clarren or Iosub) was most appropriate (best fit) for use with this Australian Aboriginal cohort, the study sample was restricted to the 42 children with no reported PAE to minimise the impact of alcohol on PFL. By definition, if a normal growth chart was appropriate for use on a particular race, the mean PFLs from that race should be normally distributed around the mean PFL for age depicted on the growth chart. The mean PFL for age on the growth chart is represented by a PFL Z-score of 0. Histograms for the 42 children were generated, depicting the distribution of PFL Z-scores generated from: the African American PFL norms,17 and each of the Caucasian PFL charts (Hall,12 Strömland,16 Clarren15). The racial histogram most closely centred on 0 was considered the best fit. One sample t-tests were used to determine which racial chart (if any) produced mean PFL Z-scores that were not significantly different to zero.
To determine whether the Caucasian Guide 1or African American Guide 2 was the best fit to our cohort, the median lip circularity for the same group (n=42) was compared with the circularity ranges corresponding to Lip Rank 3.2 A Lip-Philtrum Guide was considered ‘best fit’ if the median circularity of our Aboriginal cohort approached Lip Rank 3 of a particular guide.
Agreement between clinician and digital measures (n=106)
Children in the Lililwan Project had their PFL, upper lip thinness and philtrum assessed by paediatricians (JF and EJE) using a clear plastic ruler (for PFL, applying the Hall Caucasian chart) and African American Lip-Philtrum Guide 2.14 The same racial norms were applied to digitally assessed results to assess agreement between clinician and digital measures. Weighted kappa using quadratic weights was used to determine agreement in the following measures: three-point PFL ABC-Score, five-point lip and philtrum ranks and presence/absence of the FAS/PFAS facial phenotype as defined by the Lililwan Project protocol (two or three of these features: PFL ≤−2 SD using the Hall PFL chart, a Rank 4 or 5 upper lip and a Rank 4 or 5 philtrum using Guide 2).14 The PFAS facial phenotype as defined in the Lililwan Project (two of the three features) is not equivalent to the 4-DDC Rank 3 facial phenotype (2.5 of the 3 features). The 4-DDC Rank 3 facial phenotype for PFAS is defined by two features in the FAS range (ABC-Score=C) with the third feature very close to the FAS range (ABC-Score=B). The Lililwan Project defined the PFAS facial phenotype as two features in the FAS range (ABC-Score=C) with the third feature outside this range including in the normal range (ABC-Score=A or B). The digital Facial ABC-Scores were used to partition children into those with and without the FAS/PFAS facial phenotype as defined by the Lililwan Project. The mean difference between clinician gestalt and digital methods was examined for continuous PFL Z-scores using the Bland-Altman method.19 The number of children with FAS/PFAS facial phenotypes (2–3 features) was observed based on ratings by clinicians and the digital methods, and the percentage of exact agreement (PEA) was calculated.
Statistical analysis
Descriptive analyses were conducted using IBM SPSS Statistics for Windows, V.21.0 (IBM Corporation, Armonk, New York, USA) and MedCalc V.15.2.2 (MedCalc Software, Ostend, Belgium) was used for weighted kappa analyses and Bland-Altman plots. All data were ordinal in nature. The kappa statistics were interpreted according to the arbitrary ranges published by Landis & Koch (Strength of Agreement: Poor: <0.00; Slight: 0.00–0.20; Fair: 0.21–0.40; Moderate: 0.41–0.60; Substantial: 0.61–0.80; Almost perfect: 0.81–1.00).20 For all analyses, a 95% CI excluding 0 and/or a p value <0.05 were considered indicative of statistical significance.
Results
For this investigation, 106 children were eligible (52.8% male; mean age at date of photograph: 8.5±0.6 years). The multidisciplinary assessments conducted during the Lililwan Project confirmed a diagnosis of FAS in one child and PFAS in 12 children.21 In the cohort included in this investigation, 59/101 (58%) were prenatally exposed to alcohol (86% at a risky/high-risk level). Further details about the Lililwan Project cohort are reported elsewhere.11 21
Parent racial data were available for 103 of the included (Aboriginal) children. Most children (81/103; 78.6%) had two Aboriginal parents, while 22 (21.4%) had one Aboriginal parent (where the other parent was Maori (n=1), an ‘other’ race (n=3) or data were missing (n=18)). The remaining three children whose parents’ racial data were missing were documented as Aboriginal, and were therefore included in this analysis.
Intra-rater and inter-rater reliability
Intra-rater and inter-rater reliability results are displayed in table 1. Intra-rater agreement for both assessors in all three measures was substantial to almost perfect, with agreement values of 0.7–1.0 (p<0.05). Agreement between assessors was also substantial to almost perfect at 0.6–0.9 (p<0.05; table 1).
Intra-rater and inter-rater reliability for face measures of Australian Aboriginal children using the Fetal Alcohol Syndrome Facial Photographic Analysis Software (weighted kappa (95% CI); n=30)
Identification of best-fit racial norms (n=42)
In the 42 children without documented PAE, PFL Z-scores were generated using African American (Iosub), Caucasian (Hall), Canadian (Clarren) and Scandinavian (Strömland) PFL norms. Comparison of the distributions of the mean PFL Z-scores indicated that the Scandinavian PFL norms were best fit to our Australian Aboriginal population (p=0.08; table 2).
Fit of PFL racial norms (n=42)
The median lip circularity for our cohort was 43.90 (IQR: 39.20 to 55.58). This value was within the Lip Rank 3 range for circularity using the African American Lip-Philtrum Guide 2 (30.1 to 52.0).2
Agreement between clinician (direct) and digital measures
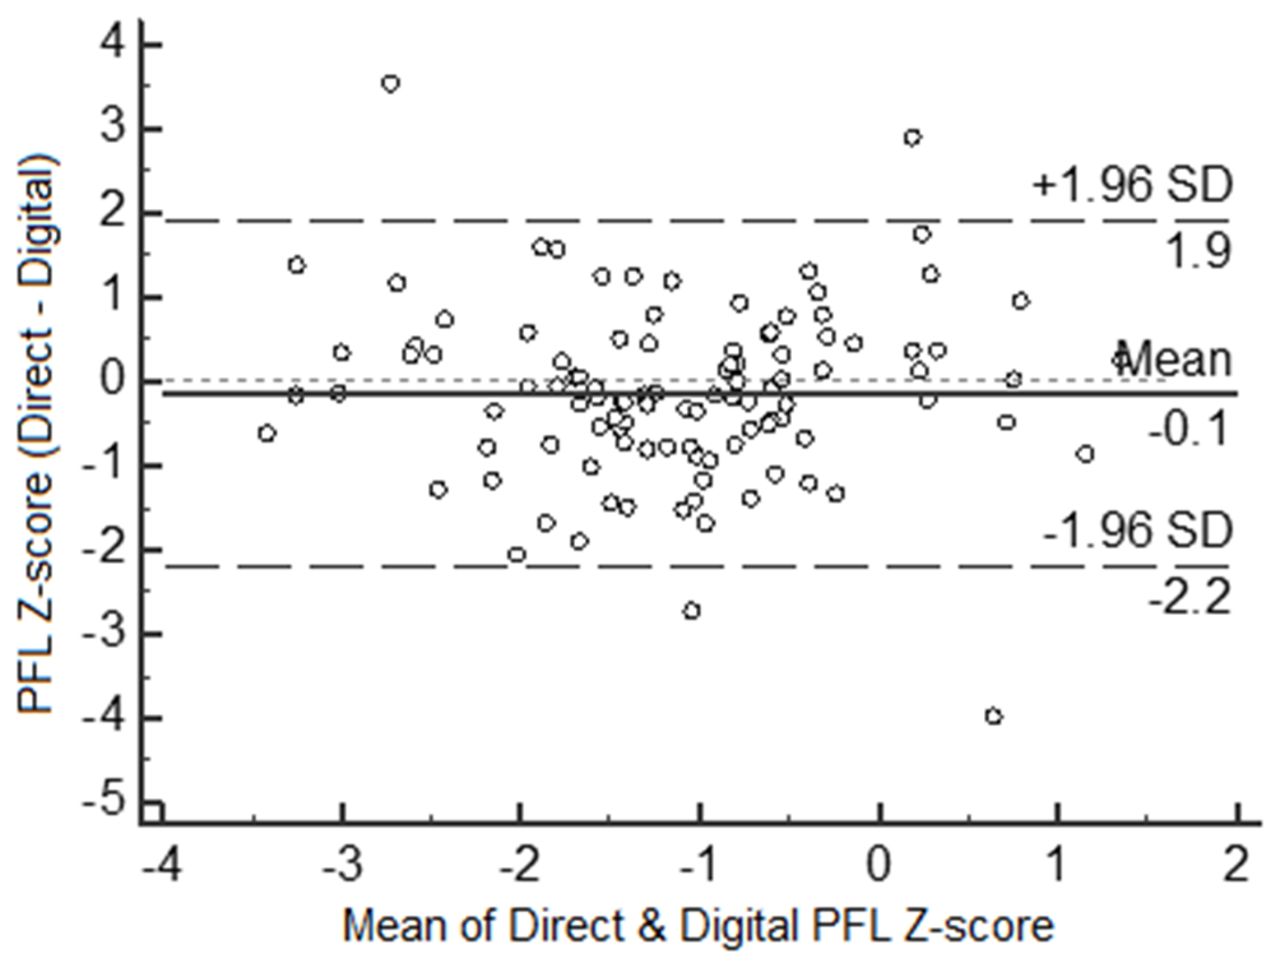
The racial charts used in the Lililwan Project were applied to our digital analyses. Moderate agreement was observed between the assessment methods in all features: Philtrum rank (kappa (95% CI): 0.58 (0.45–0.70)); Severity (0.52 (0.35–0.68)); PFL ABC-Score (0.49 (0.32–0.65)); and Lip Rank (0.47 (0.36–0.59)). The agreement and measurement bias for the continuous PFL Z-scores were further examined using the Bland-Altman method (figure 1). On average, direct measures of PFLs were slightly smaller than the digital measures, resulting in slightly lower Z-scores (mean difference: −0.14; 95% CI: −2.19 to 1.91; p=0.16). Although this was not statistically significant, the wide limits of agreement (95% CI) may be of clinical importance as differences of this magnitude would affect the PFL Z-score range into which a child would be classified.
Bland-Altman plot for palpebral fissure length (PFL) Z-scores measured by direct and digital methods.
These analyses were repeated in 92 of the lip/philtrum photos and 89 of the PFL photos, after excluding all images which were slightly blurred or unclear (eg, for PFL marker placement, the exocanthion was sometimes covered by long eyelashes in the photograph), and where there were doubts about the lips being completely relaxed. The kappa values and Bland-Altman plot results in this subset of good-quality photographs were similar to the above results (data not shown).
The number of children rated as having FAS/PFAS facial phenotypes are presented in table 3. Proportions of children with FAS/PFAS facial phenotypes were consistently higher when rated using direct compared with digital methods, and the corresponding PEA values were supportive of the moderate levels of agreement calculated using weighted kappa. In total, 29 children (27.3%) were reported as having the FAS/PFAS facial phenotype (2005 Canadian guidelines) when assessed using direct methods, compared with 16 (15.1%) when assessed digitally (table 3). The proportion of children with the PFAS facial phenotype was smaller when using the 4-DDC guidelines (table 3).
Numbers of children with FAS/PFAS facial phenotypes according to direct and digital assessment methods (n=106)
Discussion
This manuscript reports the first investigation into the assessment of the FAS facial phenotype in Australian Aboriginal children. We found that the digital assessment of the FAS facial phenotype using the FAS FPA Software had substantial to almost perfect inter-rater and intra-rater reliability, and moderate agreement with direct methods of measurement. The Caucasian (Strömland) PFL norms and the African American Lip-Philtrum Guide 2 provided the best fit for this Australian Aboriginal Cohort.
As hypothesised, the digital assessment method had substantial consistency for ranking the facial features of PFL, upper lip thinness and philtrum smoothness, both within and between two independent assessors. In contrast, high variability was identified in 21 clinicians when directly measuring the PFL using a plastic ruler.7 Our data suggest that the FAS FPA Software is very reliable and failure to use it may result in an overestimation of the FASD facial phenotype. This is consistent with a previous observation in 1027 patients in whom clinicians obtained smaller PFL measures using direct assessment methods compared with digital methods (using the FAS FPA Software).7 To be able to reliably use the FAS FPA Software in assessments in remote communities with many assessors would be efficacious, due to the simplicity and low cost of obtaining 2D photographs of participants, and of training assessors in using the software. In remote communities where resources and access to specialist services are often scarce, local staff can easily be trained to generate facial dysmorphology reports using the software for review by clinical/research staff (locally or distant) with good reliability.
Our population-based data confirm that the Caucasian (Strömland) PFL norms and African American Lip-Philtrum Guide 2 provide the best fit for our Australian Aboriginal population. With high rates of maternal alcohol use and FASD in some Aboriginal communities,21 22 it is vital to use race-appropriate norms to maximise the accuracy of diagnosis in future research and clinical practice.
Moderate agreement was observed between digital and direct measures. Due to the absence of ‘gold standard’ (eg, metal calipers for PFL) measures in our cohort, we cannot be sure if digital or direct measures were more accurate. However, from previous research, the FAS FPA Software has been far more accurate than direct measurements,7 so we can only speculate that our digital measures were more accurate than the direct measures. Despite our care in obtaining the photographs (eg, instruction to children and positioning of the camera), the accuracy of digital facial measures is dependent on many factors including the quality of the photos. With using photographs for facial analysis, the image is frozen in time unlike during direct measurement where the clinician is able to observe the child’s face in a dynamic setting. However, we attempted to investigate this potential limitation by repeating analyses only in the best quality photographs, observing an unremarkable difference in results. The high level of reliability within and between assessors when using the software is supportive of the reproducibility of the digital method of measurement, although similar reliability assessments were not undertaken for the direct measurements.
A limitation of this study was the absence of agreement data for clinician/direct ratings (to compare with our digital assessment findings), which has been reported as poor to moderate in previous literature.7 23 Scope for future work includes exploring the impact of the application of digitally assessed facial measures on FAS/PFAS prevalence in our cohort in comparison to the prevalence published based on direct measures,11 and examining the correlations between digital or direct facial measures on clinician-assessed neurodevelopmental problems.
With the emergence of digital facial analysis using three-dimensional photographs and technologies, new possibilities have arisen for the automation of digital face analysis and the identification of additional features which are harder to detect with the human eye.24 25 This may further improve the discriminatory capacity of the measures between those with and without a FAS/PFAS diagnosis, and even potentially between those with and without PAE.25 26 However, both 2D and three-dimensional photo analysis approaches are yet to produce normative values for Australian Aboriginal populations; and direct and digital assessment of 2D photographs are the current common methods in practice. The importance of referring to race-appropriate norms has been demonstrated in the present study (using 2D methods) and by Fang et al (using three-dimensional methods).24 It may be more cost effective to use the 2D technologies (compared with three-dimensional) in remote community settings in terms of equipment costs, time and labour/training costs. The FAS FPA Software was easy to use and simple to learn and train others in. Future studies should consider comparing the accuracy, reliability, validity and practicalities of both methods.
In this first investigation of the FAS facial phenotype in Australian Aboriginal children, we found that: (1) the FAS FPA Software could be easily and reliably used; (2) Caucasian (Strömland) PFL norms and the African American Lip-Philtrum Guide 2 were most appropriate for use with this Australian Aboriginal cohort; and (3) there was moderate agreement between digital and direct methods of facial assessment. The opportunity exists for comparison of direct and digital (2D and three-dimensional) methods of assessment in a larger population.
Acknowledgments
The analyses undertaken in this project were initiated by The University of Sydney, Discipline of Child and Adolescent Health, Sydney Medical School, NSW, Australia. The authors acknowledge the members of the Lililwan Project team who were involved in the set-up and conduct of the project, as well as the participants and their families. We also wish to acknowledge and thank the Reviewer (Professor Susan Astley) for her interest, support and expert suggestions for improving this manuscript.
Acknowledgments
The analyses undertaken in this project were initiated by The University of Sydney, Discipline of Child and Adolescent Health, Sydney Medical School, NSW, Australia. The authors acknowledge the members of the Lililwan Project team who were involved in the set-up and conduct of the project, as well as the participants and their families. We also wish to acknowledge and thank the Reviewer (Professor Susan Astley), for her interest, support and expert suggestions for improving this manuscript.
References
Footnotes
Contributors TWT conceptualised and designed the study and analyses reported, was an assessor of the photographs (A2), managed and analysed the data, drafted and critically revised the manuscript and approved the final manuscript as submitted. ZL-A was an assessor of the photographs (A1), assisted with the first draft of the manuscript, data entry and initial analyses and approved the final manuscript. JL was involved in the conceptualisation and design of the Lililwan Project as a Chief Investigator from which the data were collected, provided critical revisions to the manuscript and approved the final manuscript as submitted. JF was involved in the conceptualisation and design of the Lililwan Project as a Chief Investigator from which the data were collected, took some of the facial photographs used in this study and approved the final manuscript as submitted. JO was involved in the conceptualisation and design of the Lililwan Project as a Chief Investigator from which the data were collected, gave input on cultural adaptations and approved the final manuscript as submitted. MC was involved in the conceptualisation and design of the Lililwan Project as a Chief Investigator from which the data were collected, consulted on cultural adaptations and approved the final manuscript as submitted. EJE was involved in the conceptualisation and design of the Lililwan Project as a Chief Investigator from which the data were collected, and was involved in the conceptualisation of the study reported and taking of some of the photographs used in this study. She provided critical revisions and approved the final manuscript as submitted.
Funding TWT was funded by a National Health and Medical Research Council (NHMRC) Project Grant (#: 1024474), while EJE was funded by NHMRC Practitioner Fellowships (#: 457084 and 1021480). ZL was supported by a Summer Research Scholarship funded by The University of Sydney (Sydney Medical School), the NHMRC-funded Lililwan Project, and the Australian Paediatric Surveillance Unit. JL was supported byan Australian Research Council Future Fellowship (#: 0130007). JF was supported by a McCusker Clinical Research Fellowship. The Lililwan Project (from which the photos analysed were sourced) was funded by the NHMRC, the Department of Families, Housing, Community Services & Indigenous Affairs, the Department of Health and Ageing and The University of Sydney (Sydney Medical School). The authors have no financial relationships relevant to this article to disclose.
Competing interests None declared.
Ethics approval The University of Sydney, Western Australian Aboriginal Health Information Ethics Committee, Western Australian Country Health Services Board, Kimberley Aboriginal Health Planning Forum.
Provenance and peer review Not commissioned; externally peer reviewed.