Article Text

Abstract
Objective Immunosuppressant therapy plays a pivotal role in transplant success and longevity. Tacrolimus, a primary immunosuppressive agent, is well known to exhibit significant pharmacological interpatient and intrapatient variability. This variability necessitates the collection of serial trough concentrations to ensure that the drug remains within therapeutic range. The objective of this study was to build a population pharmacokinetic (PK) model and use it to determine the minimum number of trough samples needed to guide the prediction of an individual’s future concentrations.
Design, setting and patients Retrospective data from 48 children who received tacrolimus as inpatients at Primary Children’s Hospital in Salt Lake City, Utah were included in the study. Data were collected within the first 6 weeks after heart transplant.
Outcome measures Data analysis used population PK modelling techniques in NONMEM. Predictive ability of the model was determined using median prediction error (MPE, a measure of bias) and median absolute prediction error (MAPE, a measure of accuracy). Of the 48 children in the study, 30 were used in the model building dataset, and 18 in the model validation dataset.
Results Concentrations ranged between 1.5 and 37.7 µg/L across all collected data, with only 40% of those concentrations falling within the targeted concentration range (12 to 16 µg/L). The final population PK model contained the impact of age (on volume), creatinine clearance (on elimination rate) and fluconazole use (on elimination rate) as covariates. Our analysis demonstrated that as few as three concentrations could be used to predict future concentrations, with negligible bias (MPE (95% CI)=0.10% (−2.9% to 3.7%)) and good accuracy (MAPE (95% CI)=24.1% (19.7% to 27.7%)).
Conclusions The use of PK in dose guidance has the potential to provide significant benefits to clinical care, including dose optimisation during the early stages of therapy, and the potential to limit the need for frequent drug monitoring.
- pharmacology
- therapeutics
- cardiac surgery
- pediatrics
This is an Open Access article distributed in accordance with the Creative Commons Attribution Non Commercial (CC BY-NC 4.0) license, which permits others to distribute, remix, adapt, build upon this work non-commercially, and license their derivative works on different terms, provided the original work is properly cited and the use is non-commercial. See: http://creativecommons.org/licenses/by-nc/4.0/
Statistics from Altmetric.com
What is already known on this topic?
Tacrolimus is a primary immunosuppressant agent in preventing graft rejection in children receiving heart transplant.
Tacrolimus suffers from substantial interpatient and intrapatient pharmacological variability.
What this study hopes to add?
This study identifies age, creatinine clearance and fluconazole use as patient-specific factors which impact tacrolimus pharmacokinetics.
The pharmacokinetic model demonstrates that as few as three concentrations can successfully guide the model to predict an individual’s future concentrations.
Introduction
Heart transplantation is an accepted therapeutic option for children with congenital heart disease and cardiomyopathy. More than 400 heart transplants are performed annually in children across the USA with improving outcomes in recent decades, though mortality from rejection, infection and coronary vasculopathy remains significant.1 2 Transplant survival in excess of 20 years following heart transplantation has been observed, with more than 70% of transplants expected to achieve greater than 5-year survival.2 3 Much of this success can be attributed to the use of immunosuppressive therapy to prevent the rejection of the transplanted cardiac tissue.
The calcineurin inhibitors tacrolimus and ciclosporin play a vital role in immunosuppressive therapy. Currently, tacrolimus is preferred in comparison to ciclosporin, owing to its improved safety profile, especially with regard to hypertension and dyslipidaemia.4 However, tacrolimus suffers from extensive interpatient and intrapatient pharmacokinetic (PK) variability, which necessitates frequent drug monitoring to guide dosing strategies. PK of tacrolimus in children has primarily been studied in those patients receiving liver or kidney transplants.5–13 There are few descriptions of tacrolimus PK in heart transplant recipients, especially in children, and a population PK model has yet to be described for the paediatric population.
The current study has two objectives. First, we aimed to develop a population PK model of tacrolimus in paediatric heart transplant recipients. In addition to describing PK of tacrolimus in the paediatric heart transplant population, the population PK model can assess the sources and extent of variability associated with tacrolimus concentrations. Second, the number of tacrolimus concentrations needed for the model to accurately predict an individual’s future concentrations was assessed. This analysis was used to determine if the model could potentially reduce the drug monitoring burden in children receiving heart transplants.
Methods
Data collection
Study approval was granted by the University of Utah, Intermountain Healthcare and Primary Children’s Hospital Institutional Review Board. Data for this study, including event times, dose amount, tacrolimus concentrations and demographics, were collected retrospectively from the Intermountain Healthcare Enterprise Data Warehouse. The study included children receiving tacrolimus during an inpatient stay at the Primary Children’s Hospital in Salt Lake City, Utah within the first 6 weeks following heart transplant between the years of 2007 to 2015. Furthermore, children meeting these criteria must have had at least one dose of tacrolimus and one tacrolimus concentration to be incorporated into the study. Data collected between 2007 and 2013 were used for model building, whereas 2014 and 2015 data were used for model validation. Clinical dosing information was verified by scanning a bar code on the patient’s bracelet immediately prior to tacrolimus administration. Tacrolimus was typically administered two times per day, either orally or enterally through a nasogastric or nasojejunal tube. In addition to tacrolimus, all patients received mycophenolate as part of their immunosuppressive regimen, and milrinone was used to provide cardiac support post-transplant. Concentrations were determined from whole blood using a validated liquid chromatography–tandem mass spectrometry (LC–MS/MS) method at ARUP Laboratories. The assay was linear between 1 and 40 ng/mL. Sample times were determined relative to the first dose of tacrolimus.
PK modelling
PK modelling used NONMEM software (V.7.3; ICON Development Solutions) interfaced with PDx-Pop (V.5.0). The first-order conditional estimation with interaction method was used throughout model building and evaluation. Model selection was based on parsimony, objective function value (OFV) and visual diagnostic plots. Models were parameterised on the elimination rate constant (ke ) and volume (Vd ), along with the oral absorption rate (ka ) (TRANS1). One (ADVAN2) and two (ADVAN4) compartment structural models were evaluated, along with additive, proportional and combined (additive and proportional) error models, to determine the best base model for the data.
After the base model was established, covariates were tested in the model using a stepwise forward inclusion (p<0.05)–backward exclusion (p<0.01) regression method. Covariates were added to the model in a stepwise fashion and allowed to remain in the model if covariate inclusion decreased the OFV by at least 3.84 (p<0.05, χ2 df=1), and its exclusion increased the OFV by at least 6.63 (p<0.01, χ2 df=1). Categorical covariates, including sex, administration type (oral or via feeding tube), diet (ad libitum or prescribed diet) and use of comedications known to inhibit or induce tacrolimus metabolism (fluconazole being one example), were tested by fitting model parameters to the following equation.

Where θ * pop is the covariate adjusted parameter estimate, θpop is the population parameter estimate, Δ is the parameter estimate change for those with a covariate value of 1 and γ refers to the value of the covariate, either 0 or 1. Postoperative day (POD) was tested in the model on ke using an Emax/EC50 model, with and without a Hill coefficient.

Other continuous covariates, such as weight, age, body mass index and creatinine clearance (calculated using the bedside Schwartz equation), were population median-normalised and incorporated into the model using the following equation:

In this equation, θ * pop is the covariate adjusted parameter estimate, θm is the parameter estimate for an individual with the median value of the covariate, COVi is the individual covariate value, COVmedian is the population median covariate and γ refers to the exponent. Missing data were carried forward or backwards for up to 48 hours, as appropriate, beyond which, population median values were imputed.
Model validation included a prediction corrected visual predictive check and bootstrapping accomplished using PsN 4.4.0 (psn.sourceforge.net) and Pirana 2.9.2 (http://pirana-software.com), both using 1000 simulated datasets based on the data collected between 2007 and 2013. An additional model validation step compared data observed in the validation dataset (data collected in 2014 and 2015) to data simulated from the population in that dataset. Data were compared using median prediction error (MPE, a measure of bias) and median absolute prediction error (MAPE, a measure of accuracy), as shown in the following equations:


Predicting tacrolimus concentrations
The described population PK model structure was used to investigate the number of samples required to predict an individual’s future tacrolimus concentrations. The first step in this analysis was to manipulate the dataset such that patient-specific post hoc parameter estimates could be determined using only the first observed concentration from each patient. This was accomplished by changing all but each patient’s first observed concentration to be a missing dependent variable (ie, DV=−1) within the dataset used for this analysis. Notably, the first observed concentration represents a trough concentration following the first tacrolimus dose for a majority of patients. Next, an event identification (EVID) column was added to the dataset. For each row (corresponding to a time at which there was a study event, either a dose or concentration), the EVID column value was set to 0 for the concentrations being used to determine the patient-specific post hoc parameter estimates (ie, MDV=0), 1 for all dosing events and 2 when the concentration had been set to missing (ie, MDV=1). For all rows where EVID=2, NONMEM will generate an individual predicted concentration based on the patient’s post hoc parameter estimate. This manipulated dataset was then analysed in NONMEM, and the output was used to compare predicted individual concentrations to the actual observed concentrations using MPE and MAPE. For the average patient with 13 samples collected over the course of the study, the comparison between predicted and observed concentrations would use the final 12 samples (as the first sample had been used to generate the individual parameter estimates). This analysis was then repeated by sequentially including each patient’s next chronological concentration in the model, up to the first five observed concentrations for each patient. These results were used to determine the minimum number of concentrations needed to accurately and precisely predict future concentrations. An MPE and MAPE of less than 30% was targeted to define the minimum number of samples that were necessary to accurately and precisely predict future tacrolimus concentrations.
Results
Study population
Data for model building were obtained from 30 paediatric heart transplant recipients, whereas the model validation dataset included 18 children. Individuals in the model building dataset were primarily men (n=19), Caucasian (n=28), with median (range) age of 5.7 (0.1 to 17.7) years and weight of 28.9 (7.0 to 77.2) kg. The validation dataset was evenly split by sex (nine men and nine women), largely Caucasian (n=15), with median (range) age of 2.0 (0.3 to 18.4) years and weight of 11.2 (4.9 to 63.0). Median (range) doses were 0.09 (0.02 to 0.49) and 0.17 (0.03 to 0.69) mg/kg/day for the model building and validation datasets, respectively. A total of 395 samples (on average 13 per patient) were collected from patients in the model building cohort, whereas 330 samples (on average 18 per patient) were collected from patients in the model validation cohort. Approximately 40% of trough concentrations were within the target range of 12 to 16 µg/L for both datasets. Additional demographic information for the studied population is summarised in table 1.
Demographic characteristics of the study population
Population PK model
A one-compartment structural model with additive error was selected as the base model. A one compartment structural model was selected owing to the minimal improvement in model fit when a peripheral compartment was added to the model. The additive error model was chosen based on model stability. Base model parameter estimates are shown in table 2. The ka parameter was estimated during base model construction. However, estimation of this parameter resulted in some model instability, likely because limited absorption phase data were available for model building. Therefore, the ka estimated from the base model (ka =3.43/hour) was fixed to that value prior to covariate modelling.
Population pharmacokinetic parameter estimates
During the forward inclusion step of stepwise covariate modelling, creatinine clearance and fluconazole use were found to be significantly associated with ke , whereas age was associated with Vd (p<0.0001). Additionally, postoperative day was found to be significantly associated with ke ; however, the inclusion of this covariate caused significant model instability and prevented proper model convergence. As a result, this covariate was removed from the model and not included in further analyses. Including creatinine clearance in the model resulted in the greatest improvement in model fit, followed by the impact of age and, finally, fluconazole use. Tacrolimus elimination was reduced by 34% in those patients coadministered fluconazole compared with those children who did not receive fluconazole. All of these relationships were retained during the backwards exclusion modelling step. Final parameter estimates were as follows, where fluconazole use was indicated with FLUC=1 (table 2).


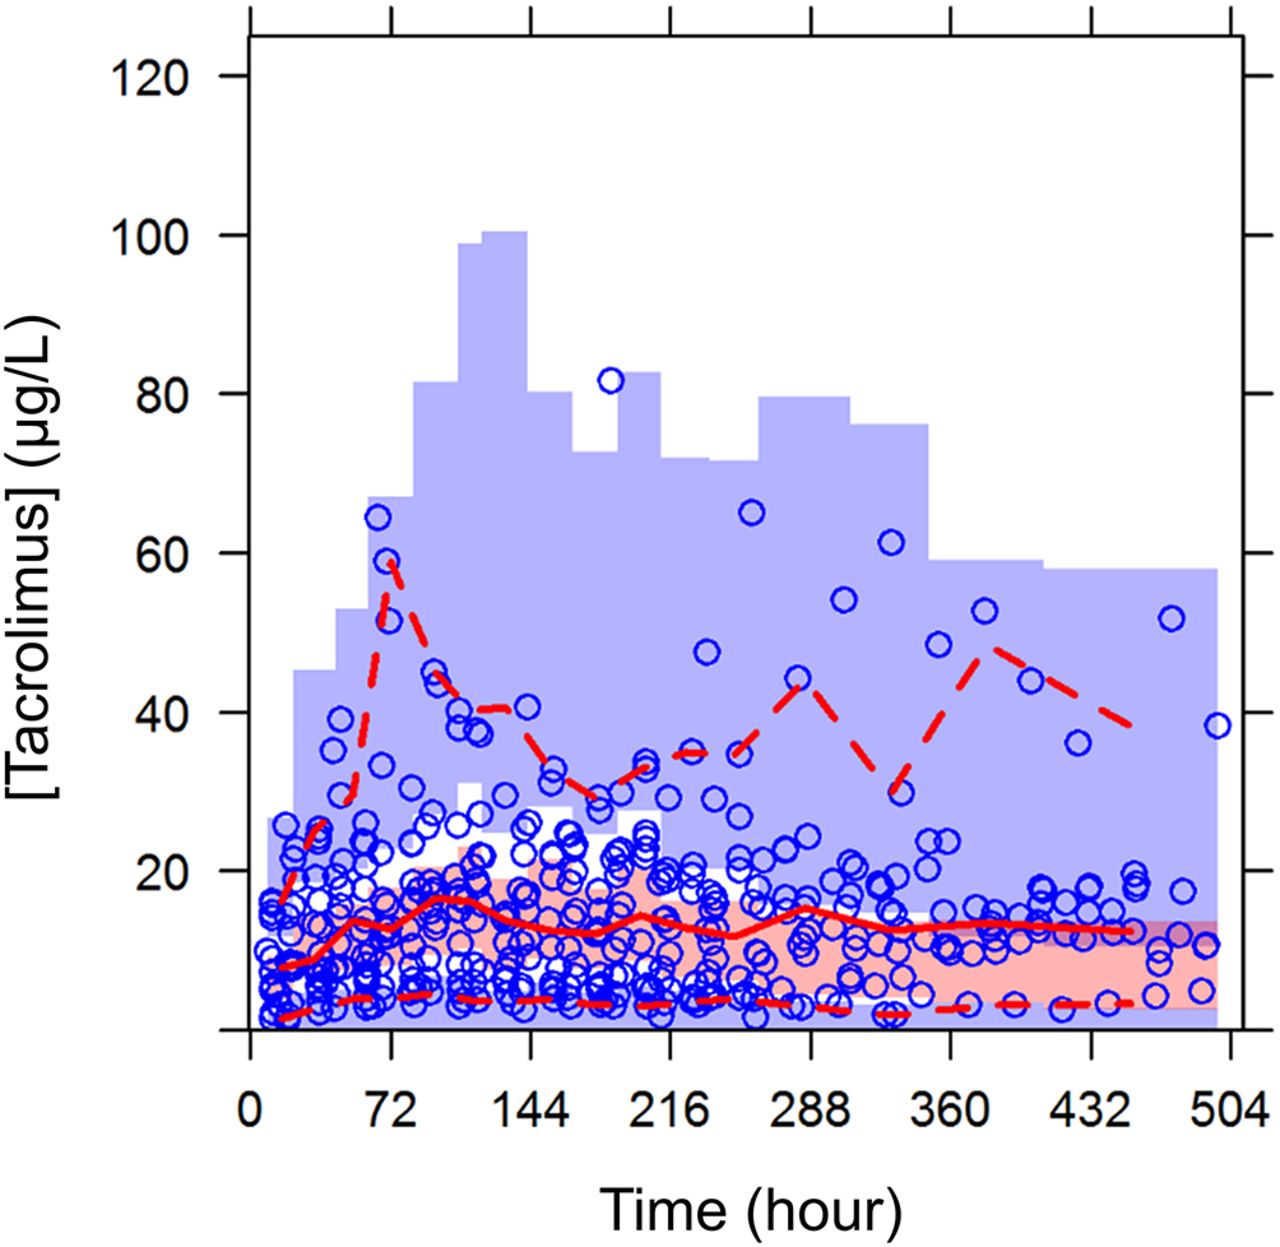
Model diagnostic plots demonstrated adequate model fit (figure 1A–D). Eta-shrinkage was 16% on ke and 14% on Vd . Visual predictive check (figure 2) and bootstrapping (table 2) supported the model. Additionally, the constructed model was validated using data collected in 2014–2015 that were not available when the model was initially constructed. The analysis supported the model as having minimal bias (MPE (95% CI): −3.8% (−7.6 to −0.27)) and good accuracy (MAPE (95% CI): 19.4% (16.9 to 22.6)) when predicting concentrations from the validation dataset. Combined, the model diagnostics and validation analysis support the fit of the described model.
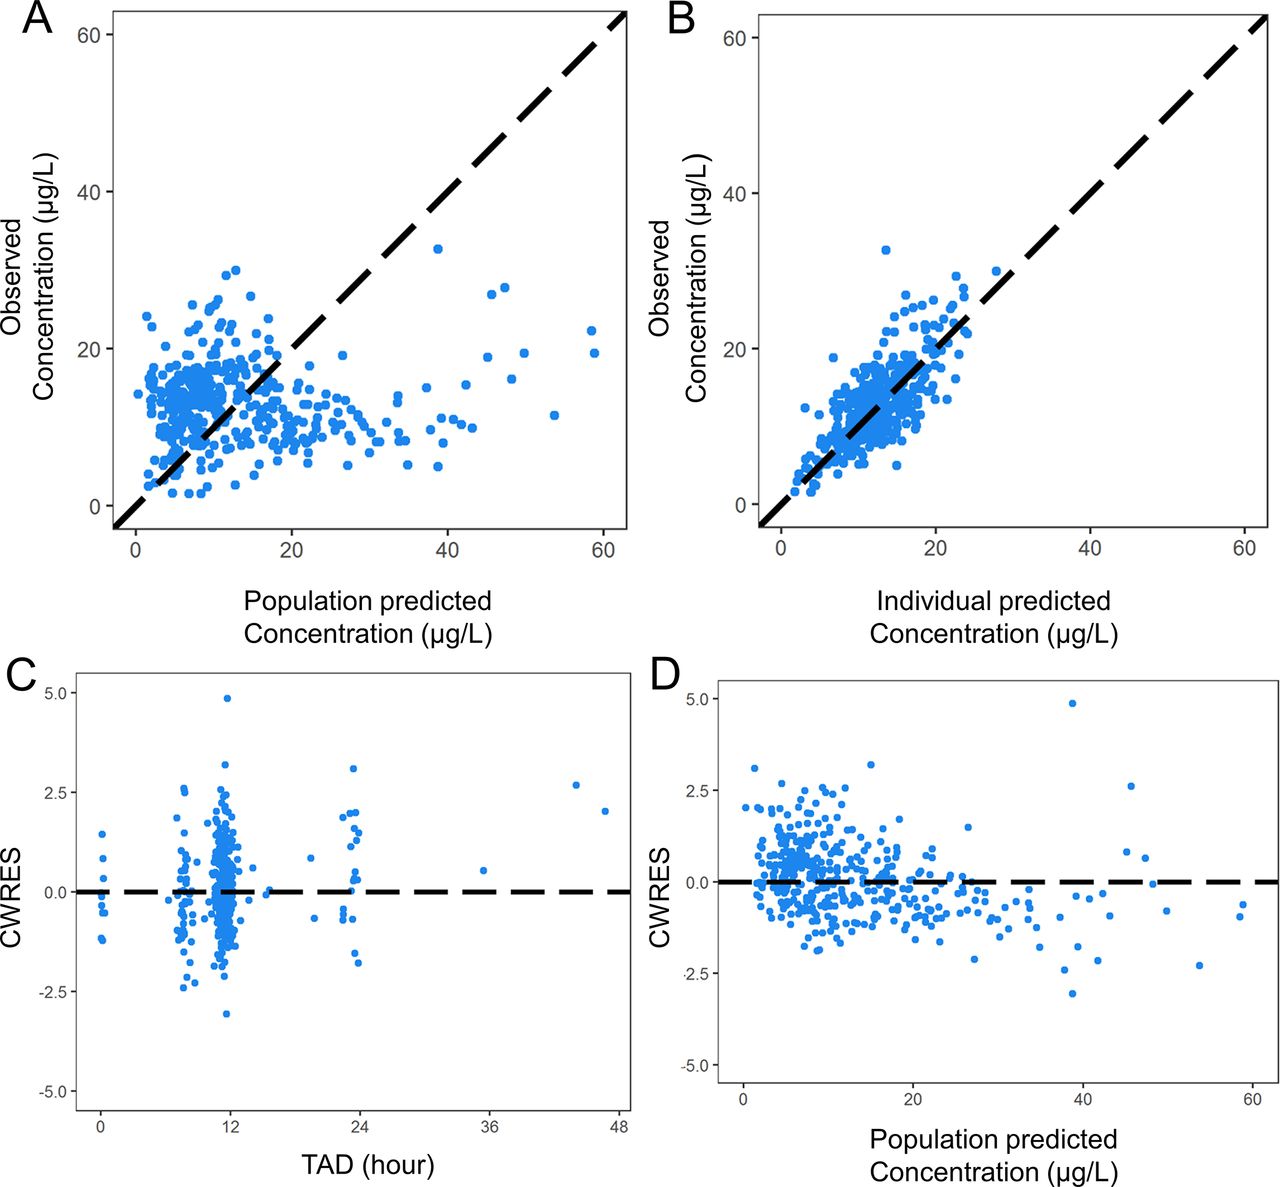
Diagnostic plots for the final model, including (A) observed versus population predicted concentrations, (B) observed versus individual predicted concentrations, (C) conditional weighted residuals versus time after dose and (D) conditional weighted residuals versus population predicted concentration. CWRES, conditional weighted residual; TAD, time after dose.
Prediction corrected visual predictive check showing observed data concentrations (blue circles) and percentiles (red dashed lines: fifth and 95th percentile, red solid line: 50th percentile) versus time. Shaded area reflects the simulated concentrations and the respective 95% CI at the fifth and 95th percentile (black dashed line, blue shading) and 50th percentile (black solid line, pink shading).
Predicting tacrolimus concentrations
The model structure (including covariates) described above was used to predict subsequent tacrolimus concentrations when between one and five concentrations were used to determine individual parameter estimates. MPE ranged between −2.1% and 1.9% (table 3), suggesting minimal bias in predicted concentrations, regardless of the number of concentrations used to guide the model. MAPE decreased from 44.0% when one concentration was used to 24.1% when three concentrations were used (table 3). The reduction in MAPE (therefore, the improvement in accuracy) from three to five (MAPE=21.4%) concentrations was minimal. Given the minimal improvement in accuracy and the added time burden of collecting those additional samples, three concentrations were selected as the minimal number required to successfully predict subsequent tacrolimus concentrations for an individual.
Median prediction error (MPE, measure of bias) and median absolute prediction error (MAPE, measure of accuracy) when between one and five concentrations were used to guide predicted concentrations
Discussion
Tacrolimus provides great value to transplant success as the mainstay of transplant immunosuppression, but extensive interpatient and intrapatient variability complicates its clinical use. The population PK model identifies some of the causes of tacrolimus variability in paediatric heart transplant recipients, namely patient age, renal function and comedications that impact tacrolimus metabolism, such as fluconazole. Furthermore, we show that the constructed model can be used to successfully predict future tacrolimus concentrations when guided by as few as three concentrations in an individual, which may help reduce the drug monitoring burden in this patient population.
The described population PK model was used to estimate mean population parameters describing tacrolimus disposition. For a child of median age and creatinine clearance, who did not receive fluconazole, mean elimination rate and volume were 0.0408/hour and 233 L, respectively. Literature has reported a wide range of model structures and parameter estimates for tacrolimus. One-compartment and two-compartment models with and without lag times have been reported for paediatric kidney and liver transplant recipients.5 6 10 13 The differences in model structure inhibit the direct comparison of previously determined parameter estimates; however, previous reports describe elimination rates between 0.0271 and 0.102/hour (half lives between 6.8 and 25.6 hours), similar to the value observed in this study.5 6 10 11 The similarity between the elimination rate parameter in our model compared with the rates that have previously been reported supports the appropriateness of the constructed model. Furthermore, the similarity in parameter estimates between our model and those models which have been previously published supports the potential for applying this model to help guide tacrolimus dosing at other institutions and across multiple transplant organs.
We determined that concomitant use of fluconazole and creatinine clearance significantly impacted the elimination of tacrolimus, whereas age was associated with volume. The rationale behind the impact of creatinine clearance on tacrolimus elimination is unclear, as tacrolimus is predominately liver metabolised.14 However, serum creatinine levels have previously been associated with tacrolimus clearance in other population PK studies,15–17 underscoring the need for future research to understand the physiological relevance of this association. It has previously been hypothesised that high serum creatinine may be a surrogate indicator of a subclinical hepatic injury that causes altered renal blood flow15 or some other alteration in drug metabolism related to the hepatorenal syndrome.16 It is also possible that the impact of creatinine clearance in our model could be driven by changes in bioavailability caused by renal dysfunction. Notably, a study in rats found increased tacrolimus bioavailability in those animals with cisplatin-induced renal failure versus animals with normal renal function.18 More work is needed to clarify the physiological rationale behind the relationship between creatinine clearance and tacrolimus elimination and to determine the utility of including this covariate when predicting dosing requirements in patients.
The interaction between fluconazole and tacrolimus has previously been noted in liver and kidney transplant recipients. Fluconazole use was associated with a 34% decrease in tacrolimus elimination in our population, which is similar to a previous report of a 35% reduction in clearance in an adult liver transplant population.19 Another report suggests the need for a 40% decrease in tacrolimus dosing to maintain the attainment of target tacrolimus concentrations in adult renal transplant patients who were coadministered fluconazole.20 Interestingly, a study in paediatric liver transplant recipients proposed that fluconazole reduces tacrolimus elimination and that the magnitude of the reduction was dependent on the donor’s CYP3A5 genotype.12 Specifically, the authors of this study found that fluconazole reduced the hepatic clearance of tacrolimus by 30% when the donor liver expressed CYP3A5 (ie, *1/*1 or *1/*3), and 60% when the donor liver did not express this genotype (ie, *3/*3). Unfortunately, our data did not allow the analysis of the impact of CYP3A5 expression on the interaction between fluconazole and tacrolimus; therefore, future work considering the impact of this genotype when the donated organ is not the organ responsible for drug metabolism (ie, in heart transplantation) is required.
When guided by as few as three concentrations, the constructed population PK model successfully predicted an individual’s future tacrolimus concentrations with negligible bias and acceptable accuracy. The data used in our study represents drug monitoring every 12 hours (ie, trough concentrations) as is customary at our institution immediately after transplant surgery. While guiding the predictions with more than three concentrations improved the accuracy of the predictions, the improvements were small. As an example, to improve prediction accuracy by 2.4% (from an MAPE of 24.1% (3 concentrations) to 21.7% (4 concentrations)) would require an additional 12 hours of unoptimised care given the current standard practice. The minimal increase in accuracy was deemed to be insufficient compared with risk of providing unoptimised care. While the use of three concentrations to guide tacrolimus dosing must be validated clinically, these results exemplify the potential for and great benefits of providing care that is optimised and directed for an individual patient.
Previous literature has described the use of population PK models for Bayesian forecasting of tacrolimus concentrations, similar to our analysis. While most of these studies were conducted in adult kidney transplant recipients,21–29 a few studied paediatric transplant recipients.9 30–32 Across all populations, MPE (bias) ranged between −15% and 10%, whereas MAPE (accuracy) ranged from 0.8% to 40%.9 21–32 The MPE and MAPE determined in our current study compare well with these previously published studies. Notably, while other studies achieved high accuracy and low bias with frequent sampling immediately after dosing, our prediction demonstrated negligible bias and acceptable accuracy despite primarily using trough concentration data. We therefore anticipate that refining our model with more robust concentration data collected from a prospective clinical study may improve the prediction accuracy generated by our model.
Our data demonstrated that ~60% of observed concentrations in our study were outside of the target therapeutic range (12–16 µg/L). A majority of these concentrations were below the therapeutic target, suggesting the potential for increased risk of graft rejection, with the immediate post-transplant period known to be one of the highest risk periods.2 This finding underscores the need for individualised tacrolimus dosing guidance to get each patient into therapeutic range as quickly as possible. Though it is anticipated that clinicians would suggest a dose increase when a trough concentration <12 µg/L is observed, this was found to be the case only 55% of the time at our institution.33 Furthermore, the uncertainty in prescribing the correct dose modification could be avoided by using individualised dosing guidance based on a population PK model.
While our analysis offers many strengths, there are some limitations. First, our study used retrospective clinical data largely consisting of trough concentrations. As a result, we did not have sufficient data to stably estimate the rate of absorption. Additionally, the lack of non-trough data likely explains the overpredictions in the population predicted versus observed concentration diagnostic plots. However, our parameter estimates agreed well with previous literature reports, and the subsequent analyses successfully demonstrated the model’s ability to predict future concentrations. Therefore, while additional data allowing the estimation of the absorption rate might improve the predictive ability of the model, the absence of that data has not significantly impacted the current clinically driven analysis. Additionally, owing to the retrospective nature of the data collected, we were unable to assess if more frequent sampling could be used to improve prediction accuracy while decreasing the time prior to optimising an individual’s dose. At the same time, the tolerability of frequent sampling in paediatric heart transplant recipients is unknown. As a result, we feel that our analysis describes a more realistic clinical scenario and is therefore applicable to clinical practice. Owing to the clinical, retrospective nature of the collected data, we do not have CYP3A5 genotype data for the studied patients. CYP3A5 genotype has been previously described to impact dosing in children receiving heart transplants.34 35 A future prospective study is needed to assess the potential for improving the model’s predictive ability when CYP3A5 genotype is incorporated. Finally, the collected data was limited to inpatients within the first 6 weeks following transplant in order to reduce variability due to non-adherence or misreported dose times that may occur in the outpatient setting. More work is needed to evaluate the utility of this approach in the outpatient setting where adherence to prescribed dose and timing of immunosuppression may be more variable, as well as validating this current model in a more heterogeneous population.
In conclusion, we constructed a population PK model that describes tacrolimus concentrations in paediatric patients receiving heart transplant. The model demonstrated success in predicting future concentrations in this population based on patient-specific characteristics (including age, renal function and fluconazole, a comedication known to affect tacrolimus metabolism), though that success needs to be replicated with a prospective trial to demonstrate its clinical utility. If successful, this approach could greatly benefit the clinical use of tacrolimus by enabling patients to achieve their target therapeutic range quickly and accurately. Maintaining a patient within target therapeutic range is expected to positively influence the rates of rejection and infection that directly impact graft and patient survival. This approach also has the potential to minimise the frequency of drug monitoring in this patient population. Delivering optimal, PK-guided, individualised directed care can provide significant and meaningful positive effects on the post-transplant lives of children receiving heart transplant.
References
Footnotes
Contributors JER performed the data analysis and wrote the manuscript. CS helped design the study and participated in the data analysis. MWL, SSK and XL edited the manuscript and helped with the data analysis. EKK queried the data and was involved in the study design. CMTS and KMM were involved in the study design and edited the manuscript.
Competing interests None declared.
Ethics approval University of Utah, Intermountain Healthcare and Primary Children’s Hospital Institutional Review Board.
Provenance and peer review Not commissioned; externally peer reviewed.
Data sharing statement Data used in this manuscript were collected from Intermountain Healthcare, which does not allow any patient data to be shared.
Author note Dr Stockmann completed his work on this project before his untimely passing.