Article Text

Abstract
Objective To investigate the predictive value of thrombospondin-2 (TSP-2) in assessing the response to intravenous immunoglobulin (IVIG) in children with acute Kawasaki disease (KD).
Methods This was a cohort study with controls. 71 children with KD were recruited as the case group, including IVIG non-responder (n=17) and IVIG responder (n=54), and healthy children (n=27) and febrile children (n=30) were used as control groups. ELISA was used to measure plasma TSP-2 and TSP-1 levels. The rank-sum test was used to compare groups of non-normally distributed data. Predictive value was evaluated through the receiver operating characteristic (ROC) curve.
Results Compared with the control groups, the plasma TSP-2 levels in acute KD were significantly elevated (TSP-2: 31.00 (24.02, 39.28) vs 21.93 (17.00, 24.73) vs 16.23 (14.00, 19.64) ng/mL, P<0.001). The plasma TSP-2 level in the IVIG non-responder was significantly higher than the responder group (37.58 (31.86, 43.98) vs 27.84 (21.88, 33.48) ng/mL, P=0.002). When using an ROC curve to analyse the predictive effect of TSP-2 on non-responsiveness to IVIG treatment, the area under the curve was 0.752 (0.630, 0.875) (P=0.002). When the cut-off value for TSP-2 was 31.50 ng/mL, the sensitivity was 82.35%, the specificity was 64.81%.
Conclusion The plasma TSP-2 level was elevated in acute KD and it might be a novel predictor for IVIG resistance, which could help guide clinicians to choose individualised initial therapeutic regimens.
- Kawasaki disease
- thrombospondin-2
- thrombospondin-1
- immunoglobulin non-response
This is an Open Access article distributed in accordance with the Creative Commons Attribution Non Commercial (CC BY-NC 4.0) license, which permits others to distribute, remix, adapt, build upon this work non-commercially, and license their derivative works on different terms, provided the original work is properly cited and the use is non-commercial. See: http://creativecommons.org/licenses/by-nc/4.0/
Statistics from Altmetric.com
What is already known on this topic?
Thrombospondins (TSPs), extracellular matrix glycoprotein, have been implicated in regulating cardiovascular inflammation and immune response.
Our previous study found that plasma TSP-2 concentration elevated in patients with Kawasaki disease (KD) in whom coronary artery abnormalities developed.
What this study adds?
TSP-2 predicts response to treatment with intravenous immunoglobulin in children with KD.
Introduction
Kawasaki disease (KD) is a systemic vasculitis that results in coronary artery lesions, coronary artery aneurysms (CAA), myocardial infarction and sudden cardiac death. Treatment with intravenous immunoglobulin (IVIG) and aspirin has decreased the incidence of CAA to 3%–5%.1 However, not all patients respond to IVIG, estimates range from 14.3% to 28.9% of children in the USA,2 20.3% of cases in Japan3 and 9.9% in China.4 Coronary artery lesions are more likely in children who are unresponsive or insensitive to IVIG treatment.5 Therefore, the identification of biomarkers for IVIG responsive patients and the selection of appropriate initial treatment strategies are critical to prevent and reduce the occurrence of coronary artery lesions and CAA.
The thrombospondin (TSP) family consists of five members, TSP-1 to TSP-5, subdivided in two groups based on their oligomerisation domain and size.6 TSP-1 and TSP-2 are from the group A and have been implicated in regulating cardiovascular inflammation and the immune response, and maintaining the integrity and function of cardiac structures.7–9 However, changes in TSP levels and their relationship to therapeutic response in KD remain unclear. Therefore, the purpose of this study was to investigate the level of plasma TSP-2 and TSP-1 in children with KD and determine whether TSP-2 can serve as biomarkers to predict the IVIG therapeutic response in KD children.
Methods
Study participants
The study was a cohort study with controls. From May 2013 to August 2014, children newly diagnosed with KD at Children’s Hospital Capital Institute of Pediatrics were enrolled in the study. The KD diagnosis was based on fifth edition diagnostic criteria revised by the Japanese KD Research Committee.10 Briefly, the criteria were: (1) fever lasting longer than 5 days (including cases who were responsive to treatment with a fever lasting less than 5 days); (2) binocular conjunctival congestion (no exudation); (3) changes in the lip and oral cavity, flushed lips and rhagades, strawberry-like tongue, oral and pharyngeal mucosal diffuse hyperaemia; (4) polymorphous rash; (5) changes in the tail end of limbs, palmoplantar redness, hard swelling in the finger (toe) tip; (6) acute non-suppurative cervical lymphadenopathy that was often unilateral, diameter >1.5 cm. KD was diagnosed if patients presented with five or more of the criteria. KD was also diagnosed in patients who met four of the criteria and had a coronary artery aneurysm or coronary artery ectasia observable by two-dimensional echocardiogram or coronary arteriography. The exclusion criteria were: (1) relapsing KD; (2) the initial treatment failure and readmission of patients with KD and (3) the presence of other vascular inflammatory diseases.
Children diagnosed with KD were administered with standard therapy, which consisted of IVIG (2 g/kg/day) (approximately 6–10 days after fever onset) and acetylsalicylic acid (ASA) (30–50 mg/kg/day until 48–72 hours after returning to normal temperature). Non-responders were defined as: (1) continued fever (>38.0°C) 36 hours after IVIG infusion or (2) recurrent fever within 7 days after IVIG infusion, accompanied by other clinical manifestations of KD.11
Two control populations were recruited, patients with a fever and healthy subjects without a fever. The febrile control group included patients with respiratory tract infections (upper respiratory infections, bronchitis, pneumonia, etc) who were hospitalised in the same period. Patients with cardiovascular disease, vascular inflammation and autoimmunity-related diseases who presented with a fever lasting for 3–5 days were excluded after a medical history examination, physical examination and laboratory examination. The healthy controls had no abnormality on physical examination, and had no reported KD, cardiovascular diseases, vascular inflammatory disease or autoimmune disease in their medical history in the Department of Child Healthcare of the same hospital.
Specimen and TSP detection
A 2 mL fasting venous blood draw was obtained from each subject between being diagnosed and receiving treatment. For children with KD, the samples were obtained on the same day before receiving IVIG treatment. The blood was injected into sealed blood collection tubes containing EDTA and centrifuged at 3000 rpm for 15 min to separate the plasma. The plasma was stored at −80°C. The levels of TSP-1 and TSP-2 were determined using the human platelet reactivity protease-linked immunosorbent assay kit per the manufacturer’s instructions (R&D Systems, USA, catalogue numbers: TSP-1: DTSP10, TSP-2: DTSP20).
The blood samples for inflammatory indicators such as the count of peripheral blood white blood cell (WBC), C reactive protein (CRP), the percentage of neutrophils (%) and platelet (PLT) were also obtained on the same day before receiving IVIG treatment. These indicators were detected by the clinical laboratory of Children’s Hospital Capital Institute of Pediatrics.
Statistical analysis
Statistical analyses were performed using SPSS V.22.0 (IBM, Armonk, New York, USA). Data were expressed as mean±SD for normally distributed variables, or as median (P25, P75) for non-normally distributed variables, or as a percentage of the patients for categorical variables. The group comparisons were conducted using the Pearson’s χ2 test for categorical data, the t-test for normally distributed data between two groups with homogeneity of variance, the Mann-Whitney U test for non-normally distributed data between two groups, the Kruskal-Wallis test for non-normally distributed data among three groups. A receiver operating characteristic curve (ROC) curve was used to calculate the area under the curve (AUC) for TSP-2 to analyse its predictive efficiency for IVIG non-response, and the Youden index was used to find the optimal cut-off value for the ROC curve. Statistical significance was established at P<0.05; all P values were two-tailed.
Results
Demographic characteristics and clinical manifestations of the KD group
The age of the patients with KD was 2.08 (1.00, 3.33) years and the group included 40 males and 31 females. Of the 71 enrolled patients with KD, 54 were IVIG responders (age 2.21 (1.17, 3.42) years; 27 males and 27 females) and 17 cases were IVIG non-responders (age 1.75 (0.92, 3.59) years; 13 males and 4 females). The clinical manifestations, including number of days of fever before IVIG, conjunctiva infection, cervical lymphadenopathy, polymorphous exanthema, fissure lips, strawberry tongue and induration of extremities, had no significant difference between IVIG non-responders and IVIG responders. The febrile control patients were 3.54 (1.50, 4.34) years of age, and included 19 males and 11 females. The healthy control group was 3.00 (2.00, 3.00) years of age and included 16 males and 11 females. There were no differences in age among the KD group, febrile group and healthy group (2.08 (1.00, 3.33) vs 3.54 (1.50, 4.34) vs 3.00 (2.00, 3.00) years, χ2=5.21, P=0.074) (table 1).
Demographics characteristics and clinical manifestations of the KD group
Comparison of the TSP-2 and TSP-1 among the KD, febrile and healthy groups
The concentration of TSP-2 in KD group was significantly higher than febrile group or healthy group (31.00 (24.02, 39.28) vs 21.93 (17.00, 24.73); 31.00 (24.02, 39.28) vs 16.23 (14.00, 19.64) ng/mL; P<0.001). The concentration of TSP-1 in KD group was significantly higher than healthy group (8668.80 (5080.80, 13095.00) vs 4715.20 (2005.80, 7983.20) ng/mL, Z=−2.88, P=0.004). The concentration of TSP-1 in KD group seemed to be higher than febrile group, whereas there was no statistical significance (8668.80 (5080.80, 13095.00) vs 6618.30 (3209.75, 11830.95) ng/mL, Z=−1.40, P=0.160) (figure 1).
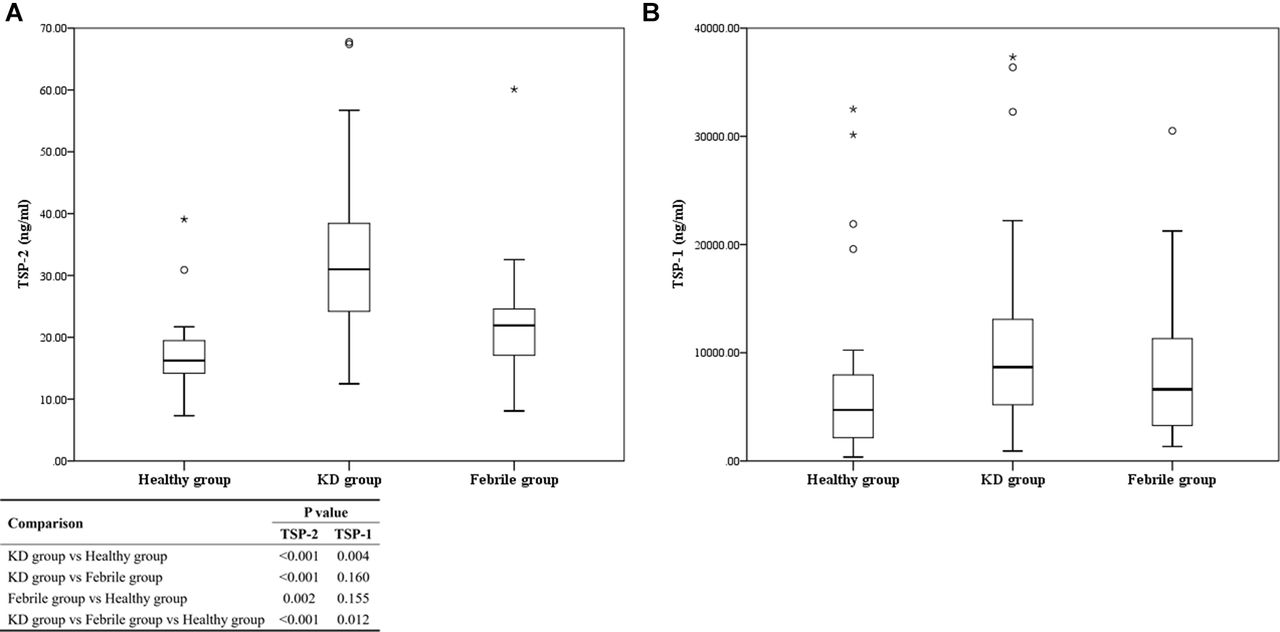
Comparison of the concentration of TSP-2 and TSP-1 among the KD, febrile and healthy groups. (A) Comparison of concentration of TSP-2. (B) Comparison of concentration of TSP-1. Rings stand for outliers which are more than 1.5 box lengths from the 25th and 75th percentiles. Asterisks stand for extreme values which are more than 3.0 box lengths from the 25th and 75th percentiles. TSP-2, thrombospondin-2; TSP-1, thrombospondin-1; KD, Kawasaki disease.
Comparison of the TSP-2 and TSP-1 between the IVIG response group and the IVIG non-response group
The plasma concentration of TSP-2 was significantly elevated in the IVIG non-responders compared with in the IVIG responders (37.58 (31.86, 43.98) vs 27.84 (21.88, 33.48) ng/mL, Z=−3.12, P=0.002). TSP-1 tended to be higher in the IVIG non-responders compared with the IVIG responders, but the difference was not statistically significant (TSP-1: 9239.80 (3817.10, 12238.50) vs 8506.20 (5390.65, 13198.20) ng/mL, Z=−0.34, P=0.736) (figure 2). For other inflammatory indicators, WBC level was higher in the non-responders than in the responders. However, there was no difference in levels of CRP, neutrophils %, PLT between the non-response group and the response group (table 2).

Comparison of the concentration of TSP-2 and TSP-1 between the IVIG response group and the IVIG non-response group. (A) Comparison of the concentration of TSP-2. (B) Comparison of the concentration of TSP-1. Rings stand for outliers which are more than 1.5 box lengths from the 25th and 75th percentiles. Asterisks stand for extreme values which are more than 3.0 box lengths from the 25th and 75th percentiles. TSP-2, thrombospondin-2; TSP-1, thrombospondin-1; IVIG, intravenous immunoglobulin.
Laboratory data comparison between IVIG non-response and IVIG response groups
The ROC curve of TSP-2 to predict IVIG non-response
In the present study, the plasma concentration of TSP-2 was significantly elevated in the IVIG non-responders compared with the IVIG responders. A ROC curve was used to determine whether the plasma TSP-2 concentration could predict a KD patient’s non-response to IVIG . The AUC was 0.752 (0.630, 0.875) (P=0.002). When the cut-off value for TSP-2 was 31.50 ng/mL, the sensitivity was 82.35% and the specificity was 64.81%. The cut-off value was determined by the maximum Youden index, and the sensitivity was high which would effectively reduce rates of missed diagnosis. In contrast, the rest of parameters including WBC, CRP, neutrophils % and PLT showed a lack of statistical power (P>0.05) for evaluating the likelihood of occurrence of IVIG resistance (figure 3).

The ROC curve of TSP-2 to predict IVIG non-response. (A) The ROC curves of indicators whose levels are positively correlated with severity of KD. (B) The ROC curve of PLT whose levels are negatively correlated with severity of KD. The solid curve represents TSP-2, and the dashed curves represent other indicators. AUC, area under the curve; CRP, C reactive protein; IVIG, intravenous immunoglobulin; PLT, platelets; ROC, receiver operating characteristic; TSP-2, thrombospondin-2; TSP-1, thrombospondin-1; WBC, white blood cells.
Discussion
Approximately 15%–25% of patients with KD do not respond to the standard regimen of oral aspirin and IVIG.12 Predicting the therapeutic response of patients with KD to the standard treatment regimen in the early phase of the disease is critical in preventing and treating coronary injury and has gained momentum in recent years. Kobayashi et al 13 devised a scoring system in 2006 by using sodium, days of illness at initial treatment, aspartate aminotransferase, neutrophil, CRP, age and PLT. Another study4 reported that erythrocyte sedimentation rate, glutamic-pyruvic transamine, WBC, serum albumin, the time from onset to IVIG treatment and IVIG dosage were risk factors for refractory KD. Uehara et al 3 considered that the initial IVIG before the fifth day of illness, boys, low PLT, elevated alanine aminotransferase and CRP were significantly related to IVIG non-response. The above parameters could be classified as some common clinical profiles and laboratory findings. Our previous research14 found the Kobayashi system and some other models established by these indicators were deficiently precise to be clinically applied to our population. Therefore, we speculate that some other factors might have not been found in regard to the IVIG therapeutic response of children with KD during the acute phase. Cytokines, also have been reported as early predictor for IVIG non-responders.15 16 Nevertheless, some patients with other diseases can also be observed with a high level of cytokines before treatment, such as bacterial infections, pneumonia and sepsis, sometimes even ‘cytokine storms’ occurring after infection. Therefore, cytokines are not stable and specific biomarkers for assessing the severity of KD. In view of these reasons, we aimed to find a simple novel biomarker to predict the risk of IVIG resistance.
We have previously reported that plasma levels of TSP-2 and TSP-1 were significantly increased in children with KD presenting with coronary artery dilatation.17 Here, we show that in the acute phase of KD, the plasma TSP-2 and TSP-1 concentration was significantly elevated relative to healthy control and patients with an unrelated fever. The TSP-2 concentration in IVIG non-responders was significantly higher than in IVIG responders. To examine the possible predictive value of plasma levels of TSP-2 for the responsiveness of IVIG therapy, we used ROC analysis and chose the cut-off value as 31.50 ng/mL, so that the Youden index attained its maximum. The results showed that plasma levels of TSP-2 had both higher sensitivity (82.35%) and specificity (64.81%) in predicting the non-response of IVIG for treating KD. It revealed that when the plasma level of TSP-2 was >31.50 ng/mL, >80% suspected IVIG-resistant children would be recognised. Therefore, the plasma level of TSP-2 can be taken as one of the reference indices in choosing medication for children with KD. Thus, patients at high risk resistant to IVIG would be identified in time and they might benefit from a more appropriate individualised initial treatment. A scientific statement for KD from the American Heart Association in 201718 states that adjunctive therapies, such as the addition of corticosteroid or infliximab therapy to IVIG and ASA in the primary therapy of KD, lower the prevalence of coronary artery abnormalities at high risk for IVIG resistance. Therefore, it is of important clinical implications to predict high-risk IVIG non-response patients before initial treatment.
The mechanism responsible for the increased TSP-2 level in patients with KD of non-responders is unknown. As the member of extracellular matrix protein family, TSPs have an important regulatory role in cardiomyopathy, coronary heart disease, myocardial infarction and other cardiovascular diseases.19–21 Genetic polymorphisms in TSP-1, TSP-2 and TSP-4 have been linked to coronary heart disease and myocardial infarction,22 23 and elevated TSP-2 was detected in fibrotic and narrowed aortic valves.24 Agah et al 25 reported in a wound healing assay that the release of TSP-2 from VSMCs was not detected until 3 days following injury, and peaked as far out as 10 days postinjury, whereas TSP-1 was detected early after injury, peaking at 3 days and subsiding by 7 days. This finding suggests TSP-1 may function more as an acute phase reactant, but TSP-2 may be more important during the subsequent inflammation and remoulding phase. So, it is possible that the elevated TSP-2 level observed in patients with KD of IVIG non-responders related to the excessive inflammatory reaction.
IVIG is a polyclonal IgG preparation, and it remains unclear why it is beneficial in KD. One possibility is that IVIG can reduce tissue inflammation and excessive immune activation by binding to blood mononuclear cells, endothelial cells or platelet surface Fc receptor, and by doing so prevent immune-mediated injury of the intimal surface.26 IVIG has also been shown to reduce the levels of matrix metalloproteinase-2 (MMP-2), MMP-3 and MMP-9, which are significantly elevated in patients with KD.27 28 Reducing the MMP expression level played a protective role in the subendothelial basement membrane and intimal elastin. TSP plays a role in inhibiting angiogenesis by blocking binding of vascular endothelial growth factor that is assembled in the extracellular matrix to its receptor by binding to MMPs. It has been reported that TSP-1 regulates MMP activity by inhibiting conversion of pro-MMP-2 and pro-MMP-9 to the active form, and can also directly inhibit the activity of MMP-9 via MMP-3 and trypsin.21 Calabro et al have also reported an interaction between TSP-2 and MMP-2 that affects angiogenesis by reducing intercellular adhesion.29 Our present findings suggested that elevated plasma TSP-2 level might be connected with the immune response and MMP activation.
The present study has some limitations. First, the number of patients might be relatively small and all specimens were only collected from one hospital. However, considering the occurrence rate2–4 of IVIG resistance and the feature of this retrospective study, it was hardly to collect affluent samples in a short term. We hope that this finding will lead to more attention and inspiration, so that more investigations and clinical trials from multicentre will be conducted to validate these results. Second, the levels of TSP-2 were not correlated with other known parameters, such as clinical manifestations and laboratory indicators, and if these elements were added, the predicting effect might be improved. Third, the specificity of TSP-2 was lower, which may lead to misdiagnosis of some patients.
In conclusion, the plasma concentration of TSP-2 might serve as a useful indicator for predicting the risk of IVIG non-response in children with KD before starting treatment and help paediatricians planning individualised initial therapy regimens.
References
Footnotes
Contributors XL obtained funding and designed the study. SY and RS were involved in data collection, verification, analysis and specimen detection. TZ, JF and XC took part in experimental guidance. RS drafted the manuscript and SY revised the paper. XL contributed to the interpretation of the results and critical revision of the manuscript for important intellectual content and approved the final version of the manuscript. All authors have read and approved the final manuscript. XL is the study guarantor.
Funding This work was supported by Research Project for the Application of Clinical Characteristics in Capital (Grant No. Z131107002213035) and Research Fund for Clinical Technology Innovation Project of Beijing Hospital Authority (Grant No. XMLX201612).
Competing interests None declared.
Patient consent Guardian consent obtained.
Ethics approval The Ethics Committee of Children’s Hospital Capital Institute of Pediatrics (No. 2012026).
Provenance and peer review Not commissioned; externally peer reviewed.