Article Text

Abstract
Objective There have been no reports evaluating the physical growth in early childhood in Fukushima Prefecture after the Great East Japan Earthquake. We retrospectively investigated the health examination data in early childhood (aged 0–3 years).
Methods We divided the affected children into respective groups according to the interval from the disaster to the time of health examination and age as follows: group I, birth to 3–4 months in boys (1.81 (range, 0–6 months)) and girls (1.79 (range, 0–7 months)); group II, 3–4 months to 6–10 months in boys (6.37 (range, 3–9 months)) and girls (6.35 (range, 3–9 months)); group III, 6–10 months and 18 months in boys (16.2 (range, 5–22 months)) and girls (16.9 (range, 5–22 months)); and group IV, 18 months to 36–42 months in boys (21.0 (range, 18–24 months)) and girls (21.0 (range, 18–24 months)). Using height and body mass index, the health status of each group was compared with that of unaffected controls (ie, children who experienced the disaster after their health examination at 36–42 months).
Results The change in body mass index between the health examinations at 18 months and 36–42 months was significantly increased in group I (95% CI: all boys, 0.192 to 0.276 vs −0.006 to 0.062, P<0.001 and all girls, 0.108 to 0.184 vs −0.109 to −0.035, P<0.001) and group II (95% CI: all boys, 0.071 to 0.141 vs −0.006 to 0.062, P=0.002 and all girls, −0.042 to 0.024 vs −0.109 to −0.035, P=0.013).
Conclusions Children who were affected by the disaster in Fukushima Prefecture in early childhood were overweight. The use of pre-existing information, such as health examination data, was beneficial for investigating the physical growth of affected children.
- obesity
This is an Open Access article distributed in accordance with the Creative Commons Attribution Non Commercial (CC BY-NC 4.0) license, which permits others to distribute, remix, adapt, build upon this work non-commercially, and license their derivative works on different terms, provided the original work is properly cited and the use is non-commercial. See: http://creativecommons.org/licenses/by-nc/4.0/
Statistics from Altmetric.com
What is already known on this topic?
After the 2011 Great East Japan Earthquake, lifestyle diseases, such as obesity, in affected adults were reported. Recently, overweight in nursery school children aged over 3 years and who were affected by the disaster has also been reported.
What this study hopes to add?
After the disaster in Fukushima Prefecture, a trend towards being overweight was observed in early childhood (aged 1 to 3 years). The use of pre-existing data on early childhood, such as health examination data, was beneficial for investigating the physical growth of the affected children.
Introduction
The Great East Japan Earthquake occurred on 11 March 20111 and caused a great deal of damage in the areas of Iwate, Miyagi and Fukushima Prefectures.2 The resultant tsunami destroyed many houses on the Pacific coast and forced many people in the area to evacuate. Moreover, the Fukushima Daiichi Nuclear Power Plant accident forced many people living around the power plant to leave their homes. Therefore, the residents in Fukushima Prefecture were likely influenced, either directly or indirectly, by the earthquake disaster. The influence of the disaster on affected adults and nursery school children over the age of 3 years has been reported.3–9 In this study, we performed a growth survey on children who were affected in early childhood (aged 0–3 years) in Fukushima Prefecture.
Generally, body mass index (BMI) is used to assess physical data, such as obesity, in adults. However, BMI cannot be compared among children because it varies in different age groups and changes substantially with age. In order to standardise the height and BMI in childhood according to sex and age, we used the SD score (SDS).
Methods
Study design and subjects
The survey design and population were described in detail in a previous paper.10
According to the Maternal and Child Health Act, local governments across Japan must perform health examinations between 18 months and 2 years and between 3 years and 4 years of age.11 Moreover, publicly funded infant medical examinations are carried out in Fukushima Prefecture at 3–4 and 6–10 months of age. We sought to retrospectively investigate the records of these five health examinations, including those at birth, and invited all local governments in Fukushima Prefecture to participate in the survey. Eventually, 31 of 57 local governments, representing 79.6% of the total number of births in Fukushima Prefecture during the target periods, participated in this survey (figure 1).
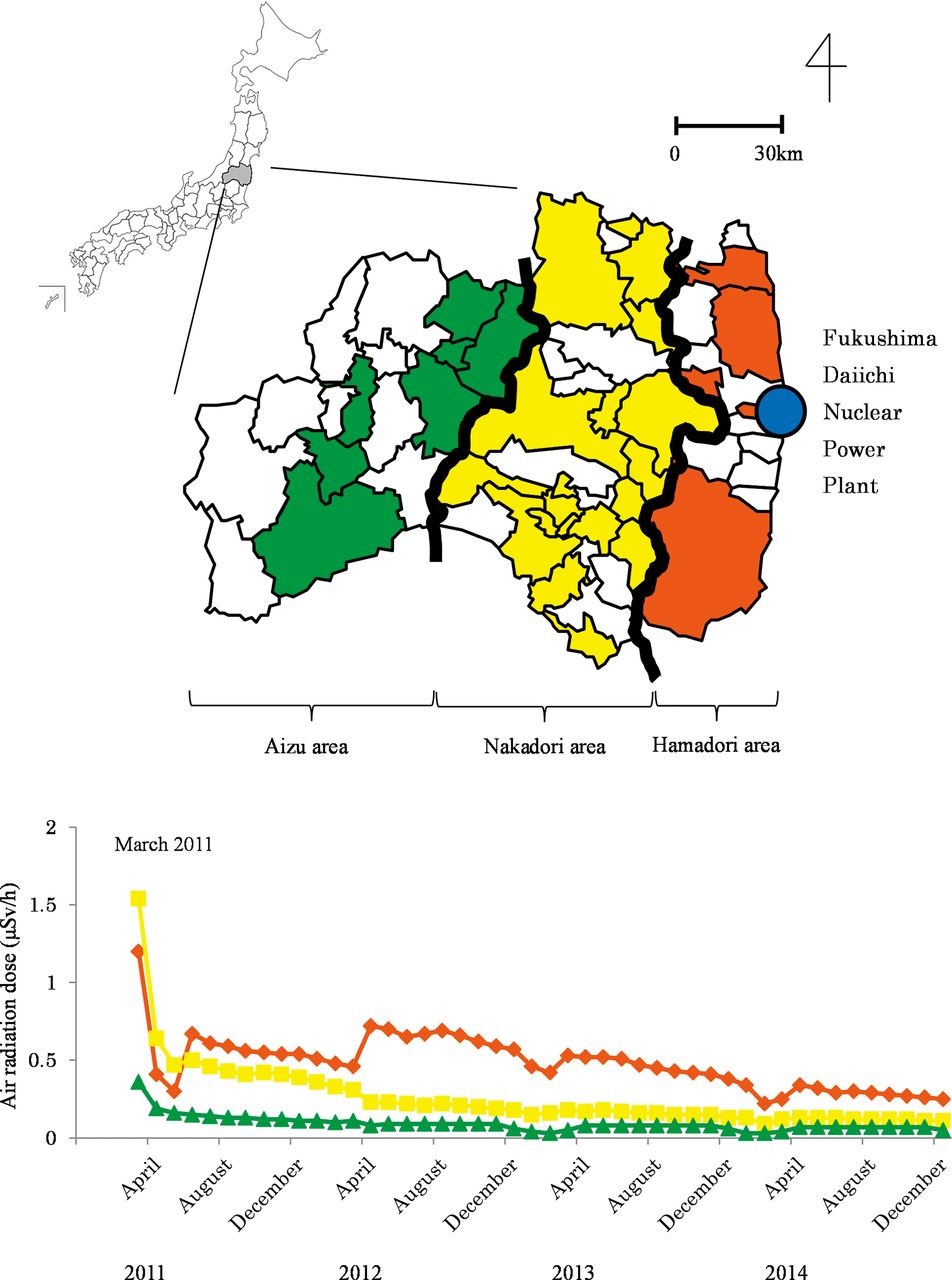
Upper: the 31 local governments that participated in this survey are shown on the map of Fukushima Prefecture. Lower: the air radiation dose from March 2011 to December 2014 for each of the three areas is shown. ◆: Hamadori area, ■: Nakadori area, ▲: Aizu area.
Data were provided by the one of the following methods: (1) completion of survey sheets by public health nurses who were employed by the local governments, (2) visits to local health centres to transcribe health examination data or (3) submission of electronic datasets of pre-existing health examination records from which all personally identifiable information was removed. The survey was conducted from July 2012 to October 2014, in order to collect data on children who were born over a relatively wide range of birth years.
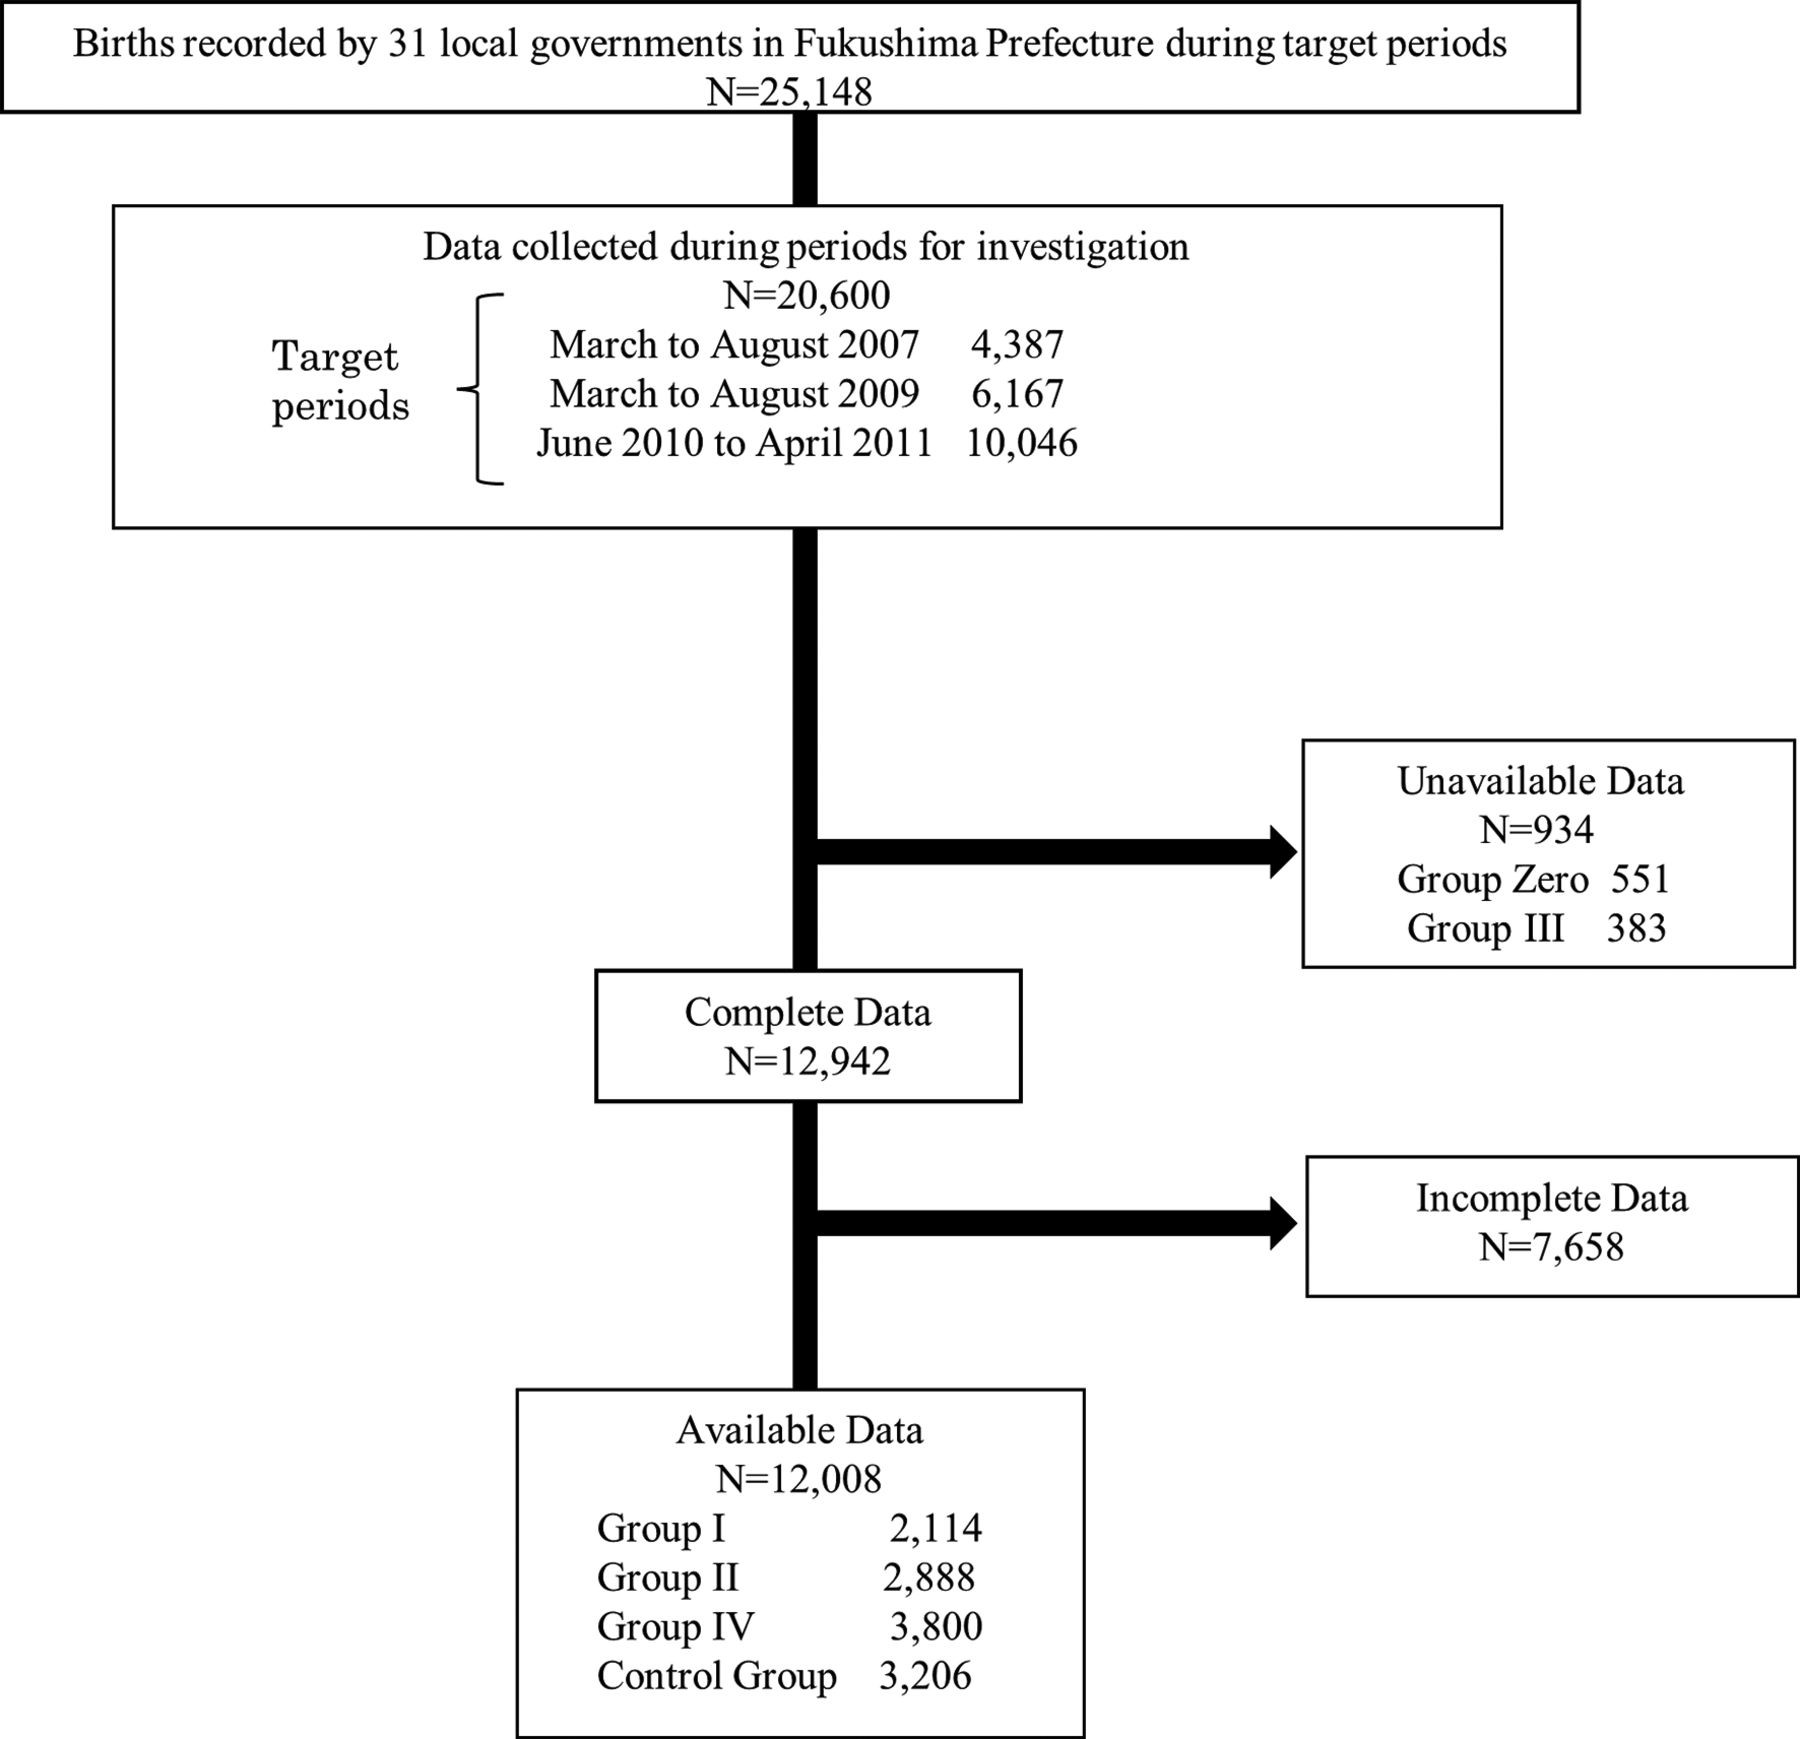
During the periods of investigation, we collected data on 4387 children who were born between 1 March 2007 and 31 August 2007 and who experienced the disaster and its after effects after their health examinations at 36–42 months; on 6167 children who were born between 1 March 2009 and 31 August 2009 and experienced the disaster before their health examinations at 36–42 months; and on 10 046 children who were born between 1 June 2010 and 30 April 2011 and who either experienced the disaster when they were under 10 months of age or were not yet born. During these target periods, data were collected from a total of 20 600 children, who accounted for 81.9% of the 25 148 total number of births registered by the 31 local governments.
We classified the children into the following six groups: (1) group zero included children who experienced the disaster before birth; (2) group I included children who experienced the disaster between birth and their health examination at 3–4 months; (3) group II included children who experienced the disaster between their health examinations at 3–4 and 6–10 months; (4) group III included children who experienced the disaster between their health examinations at 6–10 and 18 months; (5) group IV included children who experienced the disaster between their health examinations at 18 and 36–42 months; and (6) the control group, which included 3206 children who experienced the disaster after their health examinations at 36–42 months.
We aimed to compare the groups based on the age when the children experienced the disaster and their physical activity level (figure 2). In the process of gathering such necessary data (figure 3) and in order to ensure that the data gathered were from the same children in all health examinations, we used only complete data from at least four health examinations and excluded the incomplete data. Group zero represented the group of children who experienced the disease before birth and were, therefore, not eligible and excluded from this survey. The number of children who satisfied the definition of group III during the first data collection was very few. Because of this small number and the large difference in the populations, group III was not comparable with the other groups under equal conditions and was excluded. We eventually used the available data from 12 008 children.
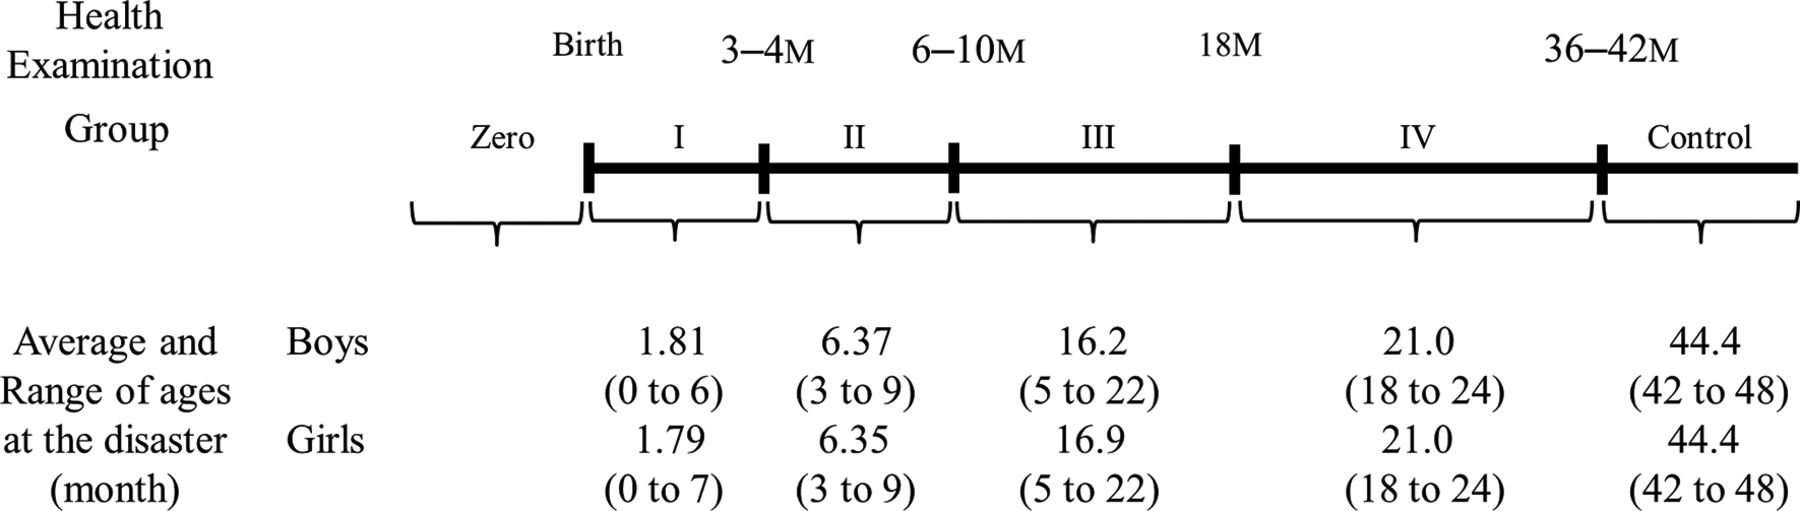
The health examination periods (birth, 3–4 months, 6–10 months, 18 months and 36–42 months) and the six groups (zero, I, II, III, IV and control) divided according to the age during the disaster and average (range) age of each group. M, month health examination.

The number of data collected from the 31 local governments participating in this survey.
From the Pacific coast side to the west, Fukushima Prefecture is separated into three areas (ie, Hamadori, Nakadori and Aizu) by mountains and highlands that are 500–2000 m above sea level. The distance from the west side of the Fukushima Daiichi Nuclear Power Plant to the Hamadori, Nakadori and Aizu areas is approximately 0–85 km, 15–100 km and 70–170 km, respectively. It was thought that the degree of actual radioactive contamination differed among the three areas (figure 1), and the influence on the residents of Fukushima Prefecture was likewise expected to differ. Therefore, we further divided each of the four patient groups according to these three areas and evaluated the corresponding influence of the disaster (table 1 and online supplementary tables S1-S6).
The sex distribution in each area and group in those with complete data
Statistical analysis
We assessed height and BMI using the records at birth and each of the health examinations undertaken at 3–4 months, 6–10 months, 18 months and 36–42 months of age. Due to the fact that BMI in childhood changes substantially with age, comparison of BMI among children of different age groups is difficult. Moreover, the age in months of children taking the same health examination varies. For that reason, it was necessary to standardise each BMI in childhood according to sex and age. Cole12 constructed centile curves for BMI using the lambda-mu-sigma (LMS) method, which was adopted by Inokuchi et al for the Japanese population.13 Therefore, we are now able to express BMI as SDS. SD is defined as the square root of the variance and represents the width of the distribution. The zero of SDS represents the average value, and the SDS represents the number of times that the SD diverges from the average value. We converted the height and BMI of all children to height SDS and BMI SDS using a calculation software,14 and then calculated the ΔBMI SDS as the difference in BMI SDS between two consecutive health examinations as follows: between birth and 3–4 months, between 3–4 and 6–10 months and between 18 and 36–42 months.
Using the Microsoft Excel 2010 software package for Windows, the t-test was performed to assess the significance of differences in height SDS, BMI SDS and ΔBMI SDS. We stratified the indicators by region and sex in order to examine the differences between the control group and groups I, II and IV. In our analysis, because there were three pairwise comparisons between the control group and the other three groups for each analysis stratified by region and sex, a P value of less than 0.016 was regarded as statistically significant using the Bonferroni correction.
Ethics committee approval
Our survey was conducted in accordance with the National Ethical Guidelines for Epidemiological Research.15 We collected only existing data and, therefore, did not obtain informed consent from the participants. Accordingly, we disclosed information, including the significance, objectives and methods of the survey, to the public via the website of the School of Medicine, Tohoku University (http://www.med.tohoku.ac.jp/public/ekigaku2013.html).
Results
We compared the height SDS, BMI SDS and ΔBMI SDS before and after the disaster between the affected children (group I, II and IV) and the unaffected children (control group). Moreover, we compared the ΔBMI SDS in these groups according to the three areas (ie, Hamadori, Nakadori and Aizu).
Height SDS
As shown in figure 4 and table 2, no significant differences were observed between the control group and groups I, II and IV.
Number, average (95% CI) and P value for height SDS in Fukushima Prefecture

Height SDS of all boys and girls in Fukushima Prefecture. ◆: control group, ■: group I, ▲: group II, ×: group IV. M, month health examination; SDS, SD score.
BMI SDS
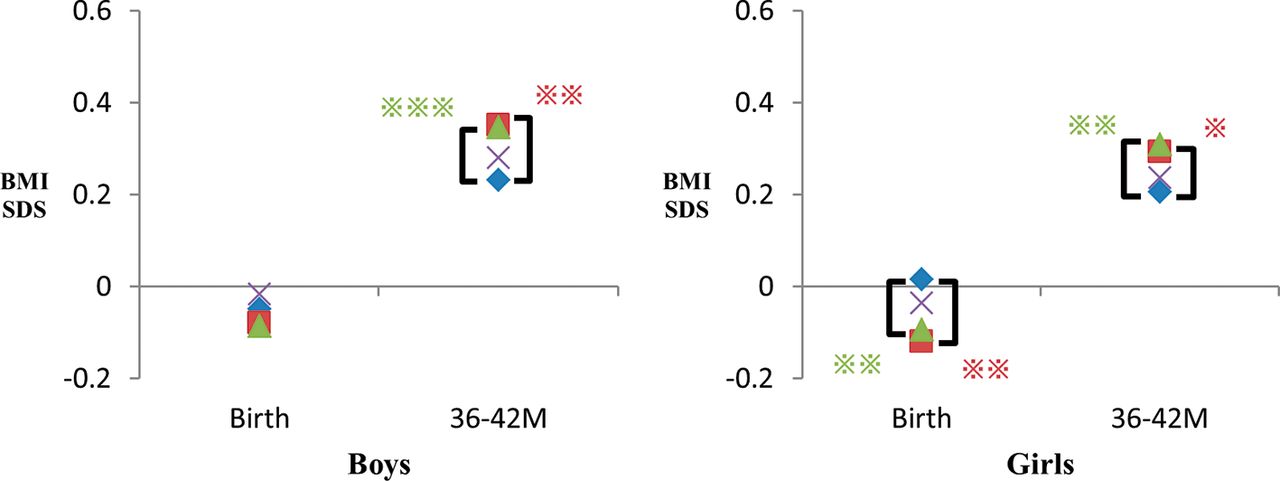
As shown in figure 5 and table 3, the BMI SDS of groups I, II and IV was equal to or less than that of the control group before the disaster. After the disaster, on the health examination at 36–42 months, the BMI SDS for boys in the control group (95% CI 0.187 to 0.277) was significantly lower than that in group I (95% CI 0.298 to 0.404; P=0.001) and group II (95% CI 0.302 to 0.390; P<0.001). For girls, the BMI SDS in the control group (95% CI:0.162 to 0.250) was significantly lower than that in group I (95% CI 0.240 to 0.346; P=0.013) and group II (95% CI 0.265 to 0.355; P=0.001).
Number, average (95% CI) and P value for BMI SDS in Fukushima Prefecture

The BMI SDS of all boys and girls in Fukushima Prefecture. ◆: control group, ■: group I, ▲: group II, ×: group IV. *P value <0.016, **P value <0.01, ***P value <0.001. BMI, body mass index; M, month health examination; SDS, SD score.
ΔBMI SDS
As shown in figure 6 and table 4, in the Hamadori area, the ΔBMI SDS between the health examinations at 3–4 and 6–10 months for boys was higher in group I than in the control group (95% CI 0.085 to 0.233 vs −0.124 to 0.030, P<0.001). The ΔBMI SDS between the health examinations at 18 months and 36–42 months was significantly higher in group I than in the control group in both boys (95% CI 0.319 to 0.473 vs −0.052 to 0.068, P<0.001) and girls (95% CI 0.208 to 0.342 vs −0.206 to −0.048, P<0.001). The ΔBMI SDS between the health examinations at 18 months and 36–42 months was significantly higher in group II than in the control group in both boys (95% CI 0.163 to 0.285 vs −0.052 to 0.068, P<0.001) and girls (95% CI 0.019 to 0.148 vs −0.206 to −0.048, P<0.001).

ΔBMI SDS of all boys and girls in Fukushima Prefecture. ◆: control group, ■: group I, ▲: group II, ×: group IV. *P value <0.016, **P value <0.01, ***P value <0.001. BMI, body mass index; ΔBMI SDS, BMI SDS between two consecutive health examinations; M, month health examination; SDS, SD score.
Number, average (95% CI) and P value for ΔBMI SDS in Fukushima Prefecture
In the Nakadori area, the ΔBMI SDS between the health examinations at 18 months and 36–42 months was significantly higher in group I than in the control group in both boys (95% CI 0.123 to 0.233 vs 0.008 to 0.100, P=0.001) and girls (95% CI 0.062 to 0.166 vs −0.086 to 0.004, P<0.001). For all of the three periods in the Aizu area, no significant differences were observed between the control group and groups I, II and IV.
Discussion
The ΔBMI SDS between the health examinations at 18 months and 36–42 months was significantly increased in children who experienced the disaster between birth and their health examination at 6–10 months. Also, a trend towards overweight children was observed in the Hamadori and Nakadori areas, but not in the Aizu area.
In the aftermath of the tsunami, Fukushima Prefecture was severely affected by the Fukushima Daiichi Nuclear Power Plant accident. The radiation levels were relatively high in the Hamadori area, somewhat elevated in the Nakadori area and only slightly elevated in the Aizu area (figure 1).16 After the accident, the Ministry of Education, Culture, Sports, Science and Technology and the Ministry of Health, Labour and Welfare of Japan jointly released a statement on restrictions to outdoor activity in all schools and nursery schools based on the air radiation. Restrictions on outdoor activity were enforced by the local governments across almost all of the Hamadori area and much of the Nakadori area that had high radiation levels.17 18
There was a relatively close correlation between the areas with high air radiation level in which restriction of outdoor activity was deemed necessary and the areas in which a trend towards overweight children was observed. The impact of restriction of outdoor activity after the disaster might have been more significant on children aged over 1 year than on other children probably because of the fact that toddlers are generally encouraged and actually begin to engage in various activities, including outdoor play, after 1 year of age.19
Body mass in young adults is strongly related to body mass in childhood.20 Moreover, an early adiposity rebound has been found to be significantly associated with BMI level at a later age and an increased risk for being overweight.21 22 Early detection of adiposity rebound is important in preventing metabolic syndrome.23 It is also important to promote early intervention in order to prevent adult obesity. Some studies have reported that stress on the affected mothers caused growth failure in children during the perinatal period24 25 and is a risk factor for childhood obesity.26 Early intervention for the affected mothers prior to delivery is, therefore, also necessary to preserve the health of their children.27
There are three limitations to this study. First, we used data from only 31 of 57 local governments that agreed to participate in this survey. Nevertheless, these local governments were large municipalities and covered 79.6% of the number of childbirths in Fukushima Prefecture during the target periods. Second, we did not investigate the causes of overweight in detail and outdoor activity itself in early childhood; there had been no comprehensive or extensive survey on outdoor activity in early childhood after the disaster. Being overweight may be associated with an unbalanced diet; the changes in the eating habits in the evacuation area were considered to be one of the causes of adult obesity.5 28 However, there are no reports on the relationship between early childhood diet, such as milk or baby food, and changes in body size before and after the disaster. Another possible cause of overweight is stress, and it has been shown that stress may cause growth failure and lead to being overweight. Sleep disorders may also be an important factor in being overweight among affected adults and children.29 30 However, we did not investigate in this study the influence of stress and sleep disorders on being overweight. Therefore, diet, stress and sleep disorders cannot be excluded as factors that might have contributed to being overweight in this study. Lastly, because the interval between data collections was more than 6 months, the number of children included in group III became much smaller than the other groups. Consecutive data collection could have minimised the difference between sample sizes of the groups analysed.
We retrospectively analysed the data on health examination and discovered that the availability of normal baseline data for comparison with those after the event were useful. The health examination data from within Fukushima prefecture is large, but not all could be obtained and the only common variables available were height and weight. The use of an online backup service and standardisation of the format of data sheets to manage health examination records nationwide will likely enable easier collection of more data.
Conclusion
After the disaster, being overweight was observed between the health examination at 18 months and 36–42 months in children who experienced the disaster between birth and their health examination at 6–10 months; this trend was observed in the Hamadori and Nakadori areas where the radiation levels were relatively high. The use of pre-existing health examination data in early childhood, when physical growth was marked, was beneficial because the physical examination findings were described in detail.
Supplementary file 1
Supplementary file 2
Supplementary file 3
Supplementary file 4
Supplementary file 5
Supplementary file 6
References
Footnotes
Contributors AO collected, analysed and interpreted the data, and drafted the initial manuscript. SK conceptualised and designed the study, obtained funding, and analysed and interpreted the data. SY, NK, TT, ZY, SC, ST, MK and SK conceptualised and designed the study, and analysed and interpreted the data. TI, HM and MI collected, analysed and interpreted the data. MH conceptualised and designed the study, analysed and interpreted the data, and reviewed and revised the manuscript. All authors approved the final manuscript submitted and agree to be accountable for all aspects of the work.
Funding This study was conducted as part of the ’Surveillance Study on Child Health in the Great East Japan Earthquake Disaster Area' and supported in full by funding from the Health and Labour Sciences Research Grant (H24-jisedai-shitei-007, fukkou).
Competing interests None declared.
Ethics approval The survey protocol was approved by the institutional review board of Fukushima Medical University (authorisation number 1487).
Provenance and peer review Not commissioned; externally peer reviewed.