Article Text

Abstract
Introduction In last few years, several studies have revealed the remarkable stability of extracellular microRNAs (miRNAs) circulating in the blood or excreted in the urine and underscored their key importance as biomarkers of certain diseases. Since miRNA in urinary sediment is relatively stable and easily quantified, it has the potential to be developed as a biomarker for disease diagnosis and monitoring. Identification of serum and urinary levels of certain miRNAs may assist in the diagnosis and assessment of disease activity in patients with nephrotic syndrome (NS). The global expression profile of miRNAs in childhood NS in Indian population remains unknown. Hence, further research is warranted in this area. This study seeks to prospectively evaluate whether a multipronged multiomics approach concentrating on microRNA expression profiles in children with NS vis-a-vis normal healthy children is discriminant enough to predict steroid responsiveness in childhood NS.
Methods and analysis In this prospective multicentric cohort study, subjects will be recruited from general paediatric and paediatric nephrology outpatient departments (OPDs) in tertiary care level referral hospitals. Age-matched and sex-matched healthy individuals with normal renal function (as assessed by normal serum creatinine and normal ultrasound of kidneys, ureter and bladder) in 1:1 ratio between study and control groups will be recruited from among the healthy siblings of children presenting to the OPDs. Differential microRNA expression profiles in urine and serum samples of children with steroid-sensitive NS (SSNS) and steroid-resistant NS (SRNS) with healthy children will be compared in a two-phased manner: a biomarker discovery phase involving pooled samples across SSNS, SRNS and healthy siblings analysed in triplicate using next-generation sequencing, slide microarray and quantitative reverse transcriptase PCR (qRT-PCR) arrays covering human miRNome followed by a validation phase with customised qRT-PCR primers based on the concordance in the discovery phase differential expression profiles and bioinformatics analysis.
Ethics and dissemination The study is funded after dueInstitutional Ethics Committee (IEC) clearance, and results will be available as open access.
- molecular biology
- paediatric practice
- nephrology
This is an open access article distributed in accordance with the Creative Commons Attribution Non Commercial (CC BY-NC 4.0) license, which permits others to distribute, remix, adapt, build upon this work non-commercially, and license their derivative works on different terms, provided the original work is properly cited, appropriate credit is given, any changes made indicated, and the use is non-commercial. See: http://creativecommons.org/licenses/by-nc/4.0/.
Statistics from Altmetric.com
Introduction
Nephrotic syndrome (NS) is the most frequent glomerular disease that presents during childhood and is primarily a podocytopathy owing to a disturbed immune function or genetic mutations. This disease is characterised by alterations in permselectivity at the glomerular capillary wall that leads to an inability to restrict the urinary loss of protein.1 Estimates of annual incidence of NS range from 2 to 7 per 100 000 children, with a prevalence ranging from 12 to 16 per 100 000.2 More than 80% of children with idiopathic NS show minimal change related to the disease on light microscopy minimal change disease (MCD) and generally respond well to treatment with steroids. Steroid responsiveness in childhood NS (steroid-sensitive NS (SSNS)) is a very good predictor of underlying histology being MCD and is an excellent prognostic marker of long-term course.3–5 Current treatment guidelines recommend a course of 4–8 weeks of daily high dose steroids before defining a case as steroid resistant. Children who turn out to be steroid resistant (SRNS) are more likely to be non-MCD, need renal biopsy to define the histopathology, require additional immunomodulation and may progress to chronicity.3 4 Majority of these are likely to be focal segmental glomerulosclerosis (FSGS), a disease with poor long-term outcome and high propensity for progression to end-stage renal disease, need for renal transplant and a significant likelihood of post-transplant recurrence.3 4 Molecular pathogenesis of NS remains complex and ill understood. Frequent relapse is a common problem, occurring in up to 90% of patients.1 3 Currently, serum albumin, lipids and proteinuria are the common diagnostic markers of childhood NS, but these markers do not accurately prognosticate the outcome of individual patients because of the heterogeneity of the disease. Renal biopsy while establishing prognoses of renal outcome has potential complications and is not routinely recommended in children with NS.5 The current paradigm of defining childhood NS as SSNS or SRNS based on a prolonged steroid exposure needs to be relooked. Newer non-invasive diagnostic and prognostic biomarkers and therapeutic targets for this disease right at the time of diagnosis are highly desirable.
What are microRNAs (miRNAs)?
miRNAs, a family of small non-coding RNAs of approximately 22 nucleotides, play important roles in various biological processes through their regulation of post-transcriptional gene silencing via base pair binding to the three untranslated region of their target mRNAs. A total of 2588 mature miRNAs are known in humans as per the current version (21.0) of the miRBase miRNAs sequence repository. Mature miRNAs are functionally active miRNAs of ~18–22 nucleotides, and they arise from precursor miRNAs of ~60–90 nucleotides. In turn, precursor miRNAs are produced from primary miRNAs that are transcribed from miRNAs host genes. While a majority of miRNAs are expressed in all types of cells and tissues and are involved in most physiological, developmental and pathological processes, changes in levels of specific miRNAs in cells and tissues have been observed with a wide variety of disease and physiological conditions.6 All cells secrete miRNAs into the extracellular matrix, primarily within membrane-bound, 20–100 nm sized vesicles called exosomes. RNA within exosomes is protected from degradation by naturally occurring ribonuclease enzymes. MiRNAs can therefore be detected in body fluids including urine. Circulating blood thus contains both extracellular miRNAs (in the plasma/serum fraction) and cellular microRNAs within the blood cells. Similarly, these are also found in urinary sediment as well as the cell-free supernatant.7 8
Unique expression profiles of miRNAs can serve as fingerprints for various diseases. Changes in their levels may reflect conditions of the affected tissues, the body’s response or the body’s predispositions. Expression patterns of miRNAs can indicate the pathophysiological status of a tissue and maybe specific for particular disease states.6 8 9 Recent studies reveal miRNAs have a relatively stable existence in the circulation and other body fluids, and their production patterns are tightly correlated with various disorders.9 Apart from changes in levels of extracellular circulating (serum/plasma) miRNAs, urinary miRNAs may be informative with respect to human pathologies and have great potential as a class of novel, non-invasive biomarkers especially of renal diseases.6 9
Is there a biological plausibility of using serum or urinary miRNAs as potential diagnostic and prognostic biomarkers for idiopathic paediatric NS as well as for targeted therapies?
While SSNS is thought to have dysregulated T-helper cell network with a tilt towards type-2 cytokine response, in SRNS, which has non-MCD histology in more than two-thirds of cases, additional processes including fibrogenesis and secondary tubule-interstitial changes are also involved.1 Since miRNAs are involved in gene regulatory pathways in inflammation as well as fibrogenesis, biological plausibility of miRNA as markers of diseases exists.10–16 The kidneys seem to have more than 300 miRNAs specific to it.6 12 Renal levels of many miRNAs correlate significantly with some renal functions and immune parameters. Bioinformatic analysis further shows some target genes of these miRNAs were associated with immune and renal pathological changes.10–13 Among these miR-192 and miR-205 are expressed preferentially in the renal cortex and are closely relevant to the renal cell biology.13–15 Changes in circulating or urinary miRNAs have been reported in a small number of patients with kidney diseases, such as lupus nephritis, IgA nephropathy and acute or chronic renal injury.10–12 Whole transcriptome sequencing of peripheral blood mononuclear cells reveals meaningful differentially expressed genes (DEGs) in paediatric idiopathic NS. Total of 1065 DEGS were identified in patients with NS (n=10) versus those in remission (n=9). These correlated with cytokine and/or immune system signalling and the extracellular matrix. Comparisons between SSNS (n=6) and SRNS (n=4) identified 1890 DEGs. These markers of steroid responsiveness were enriched with genes related to the cell cycle, targets of microRNAs and genes related to cytokines.14 The small sample size was a limitation.
Glucocorticoids, which form mainstay of therapy for NS, enhance podocyte recovery predominantly through the functional isoform, glucocorticoid receptor (GR)α. Reduced expression of GRα in podocytes from patients with SRNS compared with those with SSNS suggests that miRNAs may be a potential therapeutic target in the modulation of steroid sensitivity. Microarray screening of miRNAs in murine injured podocytes induced by puromycin aminonucleoside (PAN) revealed 10 miRNAs that were significantly upregulated, including miR 30a, miR 30d, miR 100, miR181c, miR 5099, miR 3535, miR 140 3 p, miR 148 3 p and miR 103 3 p.17 Bioinformatic target prediction indicated that the GRα was a candidate target gene of miR 30a, which negatively regulated GRα in normal and injured podocytes. Silencing of miR 30a has been speculated to improve steroid sensitivity in injured podocytes. Inhibition of miR 30a prevented podocytic apoptosis induced by PAN, and luciferase reporter assay data suggested an indirect effect on the transcriptional activity of GRα.17 Although the mechanism remains to be elucidated, miRNA inhibition opens up a novel possibility for a miRNA-targeted therapy.17 Another miRNA, miR-503 contributes to the aberrant proliferation of renal mesangial cells by targeting cyclin E, which may represent a potential diagnostic and prognostic biomarker for idiopathic paediatric NS.18 Future studies relating known genes implicated in NS pathogenesis (eg, WT-1) with miRNAs will be useful.19 Among 56 patients with primary nephritic syndromes, as compared with 50 healthy subjects, serum High Mobility Group Box 1 (HMGB-1), Chemokine [C-X-C motif ] ligand 6 (CXCL16), miRNA-30a and urinary Transforming Growth Factor Beta1 (TGF-ß1) were highly expressed in the former and correlated with the pathognomic biochemical alterations of nephrosis and were speculated to play important roles in the pathogenesis and development of these disorders.20
Published studies of miRNAs in NS
Studies of miRNAs from Indian subcontinent with renal pathophysiology have been rare.21 The scanty published studies of microRNAs in NS are cross-sectional and reported among Chinese ethnicity.12–24 Majority have focused on selected miRNAs in blood/serum (and rarely urine) in heterogenous disease groups. Global serum and urinary miRNA patterns of NS patients of Indian subcontinent are unavailable. Most studies to date have relied on a two-stage discovery/validation design incorporating screening with microarray (TaqMan Low Density Array/Affymetrix) followed by quantitative reverse transcriptase PCR (qRT-PCR)-based validation assay. Using these, few microRNAs have been identified in blood/urine among adults and children, but they remain inconsistent and non-replicated across studies. No study to day has sought to identify novel miRNAs.
Few studies have occurred in paediatric NS. Urinary miR-30a-5p and five serum miRNAs (miR-30a-5p, miR-151–3 p, miR-150, miR-191 and miR-19b) were highly increased in a cohort of Chinese children with NS children (n=159; 24 SRNS) compared with controls (n=109 healthy matched; 44 other kidney diseases) (p<0.0001).14 The area under the Receiver Operating Characteristics (ROC) curve (AUC) and Odds Ratio (OR) for the combined five serum miRNAs was 0.90 (95% CI 0.86 to 0.94; p<0.0001) and 40.7 (95% CI 6.06± to 103; p<0.0001), respectively. The miRNAs concentrations in serum and urine markedly declined with clinical improvement of the patients in 50 paired sera.14 In a subsequent study from the same group, renal biopsies from 52 cases with six different subtypes of nephropathy and 8 normal kidney tissues as controls, miR-191 and miR-151–3 p exhibited significantly higher and lower intrarenal expression in all six subtypes of kidney diseases compared with controls. The intrarenal expression of miR-150 was significantly different between MCD and some other subtypes.22 Higher (~3.5 fold) serum levels of miR-192 and miR-205 were observed in FSGS (n=30) than those with MCD (n=26) by qRT-PCR.15 In both FSGS and MCD, proteinuria correlated with level of serum miR-192. Level of miR-205 was positively correlated with the proteinuria in patients with FSGS. Serum level of miR-192 was significantly correlated with the degree of interstitial fibrosis in patients with FSGS suggesting a utility of using these markers to differentiate FSGS from MCD.15 In another study of 150 NS children and 109 age/gender-matched healthy controls, serum miR-503 was highly decreased in NS children compared with controls (p<0.0001).18
In a combined retrospective and prospective cohort study of FSGS with nephrotic proteinuria (n=78), FSGS in complete remission (n=35), membranous nephropathy (n=63), diabetic nephropathy (n=59) and healthy controls (n=69), increases in miR-125b (AUC 0.882), miR-186 (AUC 0.789) and miR-193a-3p (AUC=0.910) levels were identified in a pooled plasma sample of nine patients with FSGS compared with that of nine healthy controls and were confirmed with individual samples from patients with FSGS (n=32) and healthy controls (n=30) by RT-PCR. The AUC of the three miRNAs in combination was 0.963. Concentrations of miR-125b and miR-186 were significantly lower in patients with FSGS in complete remission (n=35) than those with nephrotic proteinuria (n=37). In a prospective component of 51 samples preremission and postremission in same study, miR-125b and miR-186 levels declined markedly in patients with FSGS with complete remission (n=29), but not those with no response (n=22), after steroid treatment. Plasma miR-186, but not miR-125b, level was correlated with degree of proteinuria in patients with FSGS in 151 samples. Plasma miR-125b and miR-186 levels were not elevated in patients with membranous nephropathy (n=63) and diabetic nephropathy (n=59) regardless of degree of proteinuria.23
In another microarray expression study, 35 miRNAs overexpressed and 24 miRNAs downregulated in patients with NS. After RT-PCR verification, six miRNAs upregulated, including hsa-miR-181a, hsa-miR-210, hsa-miR-30a, hsa-miR-942, hsa-miR-192 and hsa-miR-586. The miRNA-30a was significantly overexpressed in NS cases more so in SRNS with no difference between genders. Among different pathology types, miRNA-30a upregulated most significantly in mesangial proliferative glomerulonephritis. The miRNA-30a remains a plausible molecular marker to predict drug resistance and pathological type of NS.24 Circulating levels of miR-483–5 p and miR-557 were not significantly upregulated or downregulated, whereas miR-181a was significantly upregulated in patients with NS (n=40) as compared with healthy controls (n=16).25
Only one study to date has looked into the utility of urinary sediment miRNA levels. In a mixed cohort of adults with NS (diabetic glomerulosclerosis (DGS) (n=20), MCD/FSGS (n=21), membranous nephropathy (n=23) and healthy controls (n=10)), urinary sediment miR-29a, miR-192 and miR-200c levels were significantly different between diagnosis groups. Post hoc analysis showed that urinary miR-638 level was significantly lower in all causes of NS than healthy controls. Case with DGS had lower urinary miR-192 level than other diagnosis groups. The MCN/FGS group had higher urinary miR-200c level than other diagnosis groups.26
Gaps in knowledge
To summarise, over the past 5 years, small-scale studies in patients have been published mainly from China. While they identified different miRNAs as potential markers, the published evidence remains inconclusive as to the right sample (urine/serum) as well as the overall clinical utility of these as biomarkers of steroid responsiveness. A complete qRT-PCR array profiling of entire miRNA biome in these patients has not been carried out.12–28 No study has sought to identify any novel microRNAs by sequencing. Overall, there is a need for a wider exploration of the miRNome. Identification of serum and urinary levels of miRNA targets will help in diagnosis, assessment of disease activity as well as open up potential therapeutic targets in NS.12 Since miRNA in urine is relatively stable and easily quantified, more studies must focus on urinary miRNAs as biomarkers for disease diagnosis and monitoring. Further research and newer approaches to study the role of miRNA for defining steroid response phenotype in NS is urgently needed.
Methods and analysis
Design of study
Prospective multicentric cohort study.
Source of subjects
General paediatrics and paediatric nephrology clinics in tertiary care level referral Armed Forces hospitals.
Inclusion and exclusion criteria
Cases
Inclusion criteria
Individuals will be recruited from among consecutive cases of primary idiopathic NS between the ages 1 year and 18 years presenting over a 36-month period to various tertiary care level Armed Forces hospitals across India with the Paediatric Nephrology Center at Army Hospital Research and Referral (AHRR) serving as the coordinating centre. All cases of suspected childhood NS presenting to armed forces hospitals are referred to one of these centres for evaluation and will be eligible for recruitment into the study if they were: (A) primary idiopathic NS and (B) presenting for the first time without any immunomodulatory therapy or had an infrequent relapse profile and were off therapy for preceding 4 weeks.
Exclusion criteria
(1) Age <1 year and >18 years; (2) congenital NS; (3) secondary NS; (4) cases currently on any non-steroidal immunomodulator/immunosuppressive therapy at presentation; (5) cases exhibited to alkylating agents or Calcineurin Inhibitors (CNIs) or biologicals in the past; (6) cases with congenital anomalies of the kidney and the urinary tract (CAKUT); (7) chronic kidney disease stage II and beyond; (8) on known nephrotoxic antibiotics or nonsteroidal Anti-inflammatory Drugs (NSAIDs); (9) concurrent sepsis or serious bacterial infection; and (10) family history of NS.
Controls
Age-matched and sex-matched healthy individuals with normal renal function as assessed by normal serum creatinine and normal ultrasound of kidneys, ureter and bladder in 1:1 ratio between study and control groups recruited from among the healthy siblings of children presenting to the paediatric OPD.
Study workflow
The study will occur postenrolment of children with NS and controls in three phases as summarised in the figure 1.

Workflow of the study. Initial discovery phase: year 1–2. Objective: an initial discovery phase will study miRNA and metaboloproteomic profiles for annotation of distinguishable expression patterns in pooled bilogical replicate samples of blood and urine of primary normal children and children with SSNS and SRNS using a multipronged-omics strategy combined with bioinfomatics analysis for identification of putative candidate biomarkers as well as novel biomarkers. BR, biological replicate; NGS, next-generation sequencing; NS, nephrotic syndrome; qRT-PCR, quantitative reverse transcriptase PCR; SSNS, steroid-sensitive NS; SRNS, steroid-resistant NS; TR, technical replicate.
Sample size calculation
Since it is a pilot novel biomarker discovery study, a minimum sample size of 30 (15 in each group) would be adequate.29 A total of 20 individuals with SSNS and SRNS along with 30 controls are proposed to be followed up during the discovery phase. For the verification phase, at least 60 new cases of NS are sought to be studied along with 30 normal children.
Methodology
Blood and urine samples of all consecutive children with NS presenting to the participating centres are being collected in specimen collection tubes compatible for RNA work and transported to the coordinating centre wherein the samples are being aliquoted into four samples of 0.5–1 mL volume tubes and stored at −80°C after appropriate processing for subsequent genomic RNA and metaboloproteome analysis. Any particular matter will be removed from plasma with additional final spin at 12 000 rpm for 5–7 min at 4°.
The case recruitment is a continuous process; samples of consecutive patients with NS encountered by us are being collected. and genomic material is being archived. Cases are being managed as per standard guidelines of Indian Society of Pediatric Nephrology and would be labelled as SSNS or SRNS as per steroid responsiveness as per the standard guidelines.1 Repeat samples will be obtained after 12 weeks of onset of therapy for archiving for future study of effect of therapy on the biomarker levels. Since the inclusion criteria comprised of new cases (without any immunomodulation) as well as prevalent cases of NS (in remission and off therapy for 4 weeks), determination and classification of patients into steroid resistance and steroid sensitivity for any initial case of NS will be following exhibition to steroids as per standard guidelines on therapy and definitions of steroid resistance. Briefly, a child who received daily steroids for 4 weeks with 2 mg/kg or 60 mg/m2 of steroids and had persistent proteinuria of 2 + or more will be classified as steroid resistant. Cases will be followed up for next 24 months to further phenotype the course of the disease as well as for detection of any late steroid resistance. In the event of late steroid resistance, fresh samples will be obtained before starting any non-steroidal immunosuppression.
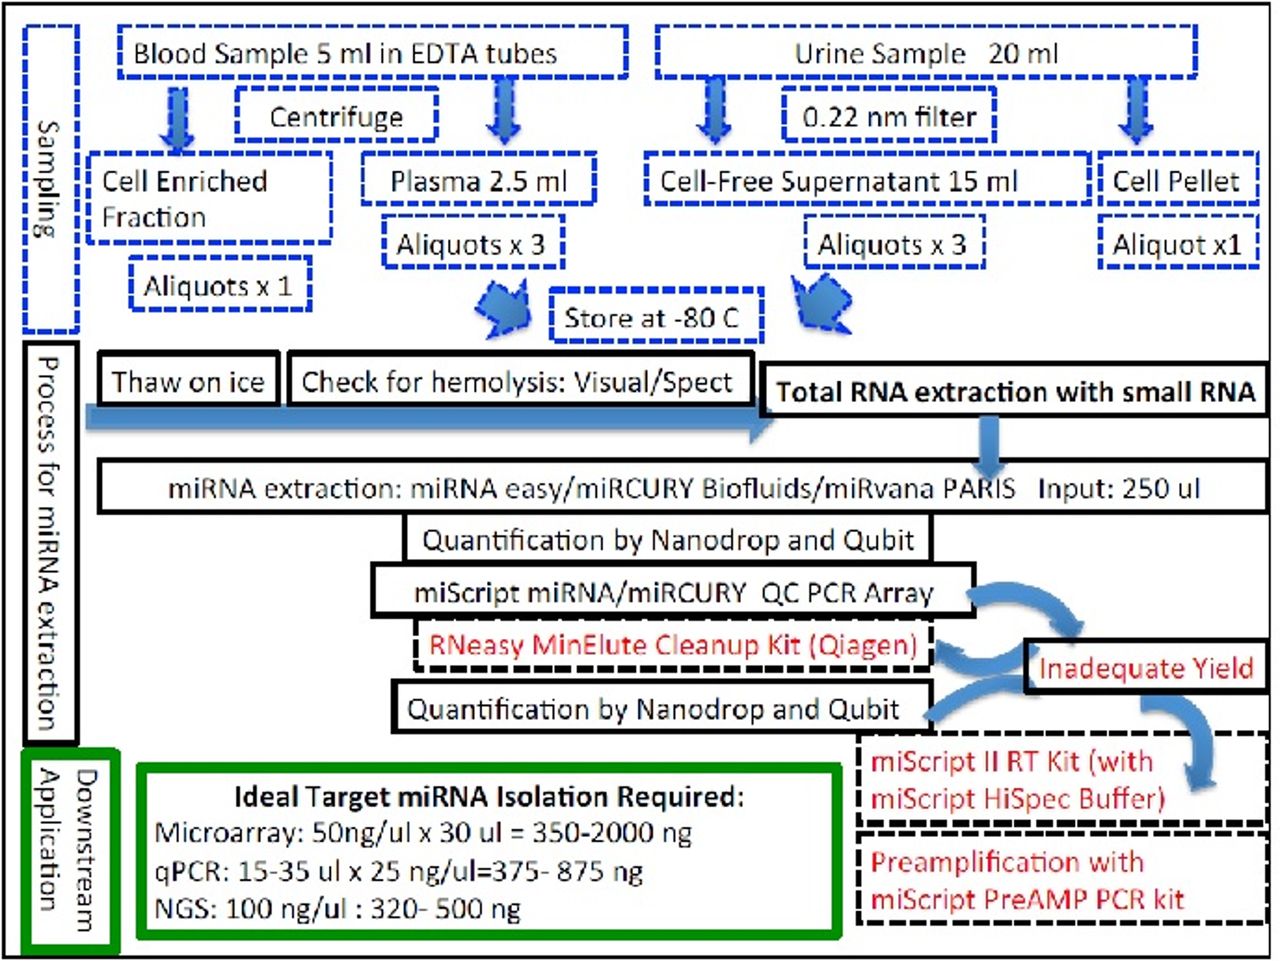
Since miRNAs are highly susceptible to environmental degradation by RNAses and the yield of RNA from clinical samples after transportation from various places will be unknown, various strategies of miRNA isolation will be evaluated during this phase for optimisation of miRNAs recovery from urine and serum/plasma before proceeding ahead with any further experiments (figure 2).
The analysis of the miRNA profiles will be done at a later point after appropriate classification has been made. After a careful phenotyping, one aliquot each from 20 cases each of SSNS, SRNS and healthy controls will be randomly selected from the archival samples using computer-generated random numbers and pooled into five different biological replicate subpools of 6 cases each in each category of SSNS, SRNS and healthy controls and subjected to screening for the miRNAa using a tripronged approach with latest release of known mature human microRNA database arrays using qRT-PCR and miRNA microarrays and next-generation sequencing (NGS) for identification of novel miRNAs. Bioinformatic analysis will be used to identify differential expression of miRNA profiles. Each biological replicate will be divided into three technical replicates prior to further analysis. At least two technical replicates will be analysed in each pool by each methodology.
MicroRNA isolation strategies.
Verification/training phase: year II–III
Objective: verification phase is for quantification of expression of individual microRNAs and metaboloproteome identified in the initial discovery pooled samples by targeted analysis of individual blood and urine samples by qRT-PCR using global human miRNome arrays incorporating latest version of miRBase 21.0 and any additional novel miRNAs discovered in the discovery phase followed by a rigorous quality control (QC) check and differential expression analysis using statistical approaches.
Individual samples of the SSNS, SRNS and healthy cases analysed in the discovery phase will undergo quantitative expression of individual serum/urine miRNAs as the steroid responsiveness/resistance signature by a two-stage experimental procedure using real-time qRT-PCR assays targeting the entire miRNome with incorporation of any novel miRNA signatures detected in the discovery phase.
Quantitative discriminant statistical and bioinformatics analysis will be carried out for hierarchical mapping and differential expression profiling of individual microRNAs for identification of individual miRNAs discriminant enough to predict SRNS versus SSNS.
Rigorous QC experiments will be carried out during this phase to identify any methodological bias.
Validation phase III year onwards
A limited validation phase on a fresh cohort of 60 NS and 30 healthy children in order to determine the efficacy of differentially expressed miRNA profiles as predictor biomarkers of steroid responsiveness/resistance using customised qPCR arrays in order to plan future large scale population-based validation studies. Validation cohort will consist of a separate cohort of individuals with initial onset NS recruited during the second year of the study. Exclusion criteria will be same as during the recruitment phase. Blood and urine samples will be obtained at recruitment into the validation cohort. A minimum of 60 cases are sought to be recruited during this period. The cut-off discriminant values of individual miRNAs identified from the discovery/verification cohort will be evaluated against these values and the clinical course over 1 year to look into their efficacy for prediction of steroid sensitivity/resistance, disease activity and progression of estimated glomerular filtration rate.
Wet and dry laboratory protocols
The protocols for miRNA work at the coordinating centre are detailed below.
Phase I: discovery phase
Sample collection for miRNA peripheral venous blood (5 mL) and urine samples (20 mL) will be collected and processed as per National Cancer Institute’s (NCI) Early Detection Research Network standard operating procedures for the collection and preparation of blood and urine samples for miRNA studies in non-heparinised containers.30 Blood samples will be divided into two fractions of: 2 mL of whole blood and 3 mL for processing for serum/plasma. Similarly, urine samples will be aliquoted into 3 mL of supernatant cell free fraction after passing through a 0.22 micron filter and the urinary cell pellet. Any particular matter will be removed from plasma with additional final spin at 12 000 rpm for 5–7 min at 4°. Once prepared, biofluid samples will be stored in RNAase-free cryotubes at −80°C until RNA isolation. Samples will not be thawed during the period between their collection and use. Transportation of samples from centres outside Delhi to AHRR will occur in specific RNA collection tubes (Norgen).8 30 At least 50 µL of RNA per sample will be extracted using commercially available miRNA isolation kits (Qiagen/Agilent/Exiqon) according to the manufacturer’s protocol with spin column extraction technology with RNAse free DNAase treatment without any carrier/spike-in (miRvana/miRvana PARIS (Agilent)/Qiagen RNAEasy/miRCURY The area under the (LNA) RNA isolation kits (Exiqon)) with enrichment of small RNA (<200 nt) (see figure 2).
Small RNA-cDNA library construction
Seven microliter of the 50 µL RNA isolates will be used to generate cDNA in a 35 µL volume using reagents and protocols provided by the manufacturer using a universal RT microRNA PCR approach (Exiqon/Qiagen).9 31 RNAs are polyadenylated for the addition of A oligomers, and then RT is performed using an dT polymer (oligo-dT) as the RT primer. For qRT-PCR cell-free urine samples miRNA purification will be followed by preamplification using preamplification kits (using 1 µL cDNA synthesis reaction for yield of microRNA from 200 µL urine) since the yield of microRNA is anticipated to be low. For the miRNA library for deep sequencing, multiplexed miRNA library will be made from each RNA sample by 3′ adapter ligation, 5′ RT primer annealing, 5′ adapter ligation, reverse transcription and PCR amplification as per a previously published protocols.31 Although the forward PCR primer is the same, a different reverse PCR primer with a unique barcode is used for each RNA sample. The different libraries will be pooled into a single sequencing reaction at the end of the library construction.
Mutliomics screening for miRNA profiles for discovery of differential miRNA profiles between SSNS, SRNS and healthy controls
Deep sequencing of small RNA for differential and novel miRNAs
Generated libraries will be sequenced using an multiplex Illumina NGS platform (HiSeq2000/2500)/Ion Torrent Proton Analyzer platform (Life Technologies) according to manufacturer protocols after further processing including denaturation, library cleanup and dilution in RNAse-free medium with at least three biological replicates per sample group for statistical tests of data comparisons.32 At least 10 million reads will be obtained for 50 bp fragments.
Computational analysis for novel miRNAs
Following sequencing, preprocessing of reads, removal of adaptors and bar codes will be performed by the Illumina/Torrent Suite (Life Technologies) pipeline depending on the platform used. Sequences will be analysed for QC (FASTQC) and aligned to the human genome (HG19) followed by screening against Rfam 10.1 and GenBank database to remove fragments of rRNA, tRNA, snRNA and snoRNA. ‘Homo_sapiens.NCBI.36.58’ will be used to identify other small RNA species and mRNA. Mapping to miRBase_v.21 and Emsembl release 19 will be done to identify known mature miRNAs. After normalisation, all miRNAs with read counts less than 10 across all patient samples will be set to 0. The data set normalised against annotated mature miRNAs will be chosen for the remaining analyses. Normalised and un-normalised read counts for all the samples will be made available at the Array Express website; accession number E-MTAB-1649 (http://www.ebi.ac.uk/arrayexpress/). In addition after eliminating repeat-associated sRNA and degradation fragments of mRNA and identifying conserved miRNAs after a search against miRBase 21.0 to rule out known miRNAs, the remained reads that do not match the above databases will be considered unannotated sequences. Novel miRNAs will be predicted from these using MIREAP (http://sourceforge.net/projects/mireap/), a computational tool that is specially designed to identify genuine miRNAs from deeply sequenced small RNA libraries.
Analysed sRNAs >10 bp in size will only be considered candidate miRNA genes if their stem-loop hairpins fulfil the following three criteria: (A) mature miRNAs are present in one arm of the hairpin precursors, which lack large internal loops or bulges. (B) The secondary structures of the hairpins are stable, with the free energy of hybridisation lower than −20 kcal/mol. (C) The hairpins are located in intragenic regions or introns. Among the novel sequences, miRNAs that were detected twice in three replicates will be chosen as novel miRNAs candidates and triplet SVM methods will be used to rule out pseudo-pre-miRNAs.32 Triplet SVM is a programme developed to integrate the triplet element features of a set of real miRNA precursors and a set of pseudo miRNA hairpins. Triplet SVM is used for predicting whether a query sequence with hairpin structure is a real miRNA precursor or not. The miRNA identified in this study will be uploaded to online repositories.
Microarray experiment for screening for differential miRNA expression
All the discovery samples in parallel will undergo global array based profiling of miRNA expression. A commercial microarray (Affymetrix GeneChip miRNA 4.0 Array (Affymetrix, Santa Clara, California, USA, catalogue number 902411)/miRCURY LNA microRNA Array, seventh generation – hsa, mmu and rno) that covers all of the mature human miRNAs available in miRBase version 21 (www.mirbase.org/) will be used to screen miRNA expressions between SSNS and SRNS groups in biological triplicate of pooled sample RNA after labelling and hybridisation. The microarray data will be deposited in Gene Expression Omnibus (GEO) at National Center for Biotechnology Information (NCBI) (http://www.ncbi.nlm.nih.gov/geo/). The microarray data will be analysed by the algorithm of significance analysis of microarrays (SAM; wwwstat.stanford.edu/~tibs/SAM/).33 The false discovery rate (FDR) will be set to <0.05 with a minimum fold change (FC) set to >2.0 or <0.5. Hierarchical clustering will be carried out using the MeV 4.9 software (Multi Experiment Viewer, http://www.tm4.org/mev.htm) to generate both miRNA and sample trees based on Pearson correlation.
Phase II: verification phase
Cross-validation of microarray and deep sequencing miRNA profiles with qRT-PCR in pooled biological replicates
After analysis by Triplet SVM to remove pseudo-pre-miRNAs, the remaining novel miRNAs will be further validated by qRT-PCR in the verification phase in the SSNS, SRNS and healthy samples. Similarly, comparison of the SSNS and SRNS and healthy groups will be made to determine differential expression of known microRNAs identified by hybridisation microarray in addition to the deep sequencing and qRT-PCR array approaches on the biological pooled replicates for identification of miRNAs predictive of steroid resistance.
Quantitative miRNA expression profiling using qRT-PCR-based global arrays in individual samples
PCR will be performed in a 384-well PCR plate on a real-time PCR system (Quant Studio 6) in each of the individual discovery samples for quantification. The RT-PCR technique is highly sensitive and has a dynamic range of >6 logs. qRT-PCR will be carried out in compliance with the MIQE guidelines.34 Overall, a specific custom-made global qRT-PCR array will be used to quantify the miRNAs in the human blood or urine in this phase. This will cover: (A) entire mature human miRNome as per miRBAse (version 21.0) (Exiqon miRCURYTM LNA Universal RT miRNA PCR Human Panel I and II/Qiagen miScript miRNome/miRBAse Profiler HC Panel) and (B) novel miRNAs discovered in the deep sequencing and microarray experiments but not available in the commercial qRT-PCR arrays.
During the qRT-PCR, 35 µL cDNA reactions will be diluted 50-fold, and 1 µL of this dilution will be used as template for PCR to amplify cDNA for a specific target RNA (such as a particular microRNA) in a 10 µL reaction. Amplification for specific RNA targets will be performed in specific wells of the plate. Fluorescence generated by the binding of SYBR Green DNA-binding dye to PCR products as they accumulate as PCR progresses is recorded. The fluorescence data for each target RNA is analysed using the ‘second derivative maximum’ method to obtain a quantification cycle or Cq value, which is inversely proportional to log2 concentration of the target RNA. The primers used during PCR will be preferably DNA oligonucleotides with some of the nucleotides in LNA form. Relative miRNA expression levels will be calculated using the ΔΔCt method as previously described.35–37
Phase III: limited validation cohort
After narrowing down of miRNAs associated with steroid resistance/responsiveness, the verification phase will be followed by design of custom-made miRNA-specific qRT-PCR arrays for use in a limited validation phase prior to a large-scale population-based validation study. A fresh cohort of 60 children with NS and 30 healthy controls will be studied during this pilot limited validation cohort in order to study the efficacy of the custom-made miRNA qPCR panel as predictors of SRNS.
The inclusion criteria for significantly upregulated/downregulated miRNAs during this validation will be as follows: a mean change >1.5 fold, a p value <0.05 for comparison of the SSNS and SRNS groups as well as NS and healthy control groups, a Cq value >3 and <35,and a detection rate >75% in either the NS cases or controls. ROC curve analysis will be done for AUC as a biomarker of steroid resistance for the miRNA.
Quality controls
Pre-miRNA profiling QCs
Sampling quality for haemolysis
The haemolytic samples will be excluded based on visual detection due to its easy operation and wide application. The thick, red supernatant after centrifugation will be considered to be haemolysed sample and excluded. In addition, measurement oxyhaemoglobin absorbance at 414 nm will be carried out to exclude samples.
RNA isolation
The quantity (ng/mL) and purity (ratio of absorbances of the RNA isolates at 260 nm and 280 nm (A260/280)) of the RNAs obtained will be evaluated by spectrophotometer/fluorometry. In addition, a commercial PCR QC array (Qiagen/Exiqon/Agilent) will be used to determine the need for preamplification of cDNA as well as quality of miRNA prior to further processing.
Post-miRNA processing QC
Differential Cq miR-451a/miR-23a-3P>7 will be calculated to exclude haemolysis.38
Microarrays/sequencing/qRT-PCR: all PCR reactions/microarrays/sequencing will be performed in biological triplicate. For qRT-PCR, melt curve analysis will be done to verify their specificity and identity. Endogenous reference control will be RNU6B.
Spike in of synthetic small nucleic acids: they will be spiked into samples before RNA isolation, before RT and before PCR. Cq values for these spike-ins provide insights on quality of RNA isolation, RT-PCR and so on. (eg, about if there was a PCR-inhibitory activity in a sample). A negative control sample (water) will also be subjected to same in the same batch as the samples.
Detection limits of the qRT-PCR assay and its dynamic range will be evaluated and used to calculate the absolute concentrations of the target miRNAs from calibration curves developed with corresponding synthetic miRNA oligonucleotides.
Statistical analysis for identification of signature miRNAs for steroid resistance/responsiveness
The statistical analyses will be performed with SPSS software V.20.0 and GraphPad Prism (V.5.0; GraphPad software) and R. The miRNA data will be presented as the mean (SE), urinary protein values will be expressed as the median (interquartile interval) and other variables will be expressed as the mean (SD). Correlations between miRNAs and various variables will be assessed with the Pearson’s correlation coefficient for quantitative variables with normal distribution and Spearman’s correlation coefficient quantitative variables with skewed distribution. Clinical characteristics will be compared using χ2 test of independence for qualitative variables, t-test of quantitative variables with normal distribution, the non-parametric Kruskall-Wallis test or the Mann-Whitney U test of quantitative variables with skewed distribution. FDR will be calculated to correct the p value. A pvalue <0.05 will be considered to be statistically significant.
Data processing of RT PCR data
RT-PCR data processing will be done using R 3.1.3 in Mac OS X 10.6.8. Since any PCR can result in a Cq value being obtained, even if the analysed sample does not have the analyte that is being examined by PCR, the raw RT-PCR data (Cq value) data will be processed to remove values that are considered unreliable. RT-PCR signal will be considered undetected (ie, the microRNA is undetected) if the Cq value is within 3 units of the Cq value for the negative control if this value exists, else if the Cq value is greater than 37.35 The processed data for the entire global miRNA panel will be saved as tab-delimited file along with group information (SSNS, SRNS and controls), and intrasample average processed Cq value for microRNAs with or without trimming (0.05 fractions of highest and lowest Cq values ignored) for all the microRNAs in the panel as well as for all the microRNAs that were detected in all the samples.
Data analysis
Data will be analysed as follows.
Detectability of microRNAs
With the above criteria, plot of the number of microRNAs that were detected in all X samples for X=1 to N will be made. Mean (range; SD) of number of miRNAs detected per sample for all samples, and group wise (SSNS, SRNS and Healthy) for blood and urine samples will be determined.
MicroRNA data normalisation
Appropriate software to identify the most appropriate normalisation strategy will be used for qRT-PCR data. For urine samples, urine spot miRNA/spot creatinine ratios will be used prior to any normalisation strategy. For microarray data, a non-linear variance normalisation algorithms normalisation strategy will be adopted. For sequencing studies, reads will be normalised to reads per million calculated as follows: number of sequenced reads/total reads/1 000 000. Global mean normalisation method is currently believed to be the best.39 40 For ‘spike-in’ normalisation, microRNA Cq values of a given sample will be adjusted by subtracting the sample’s deviations for Cq values for the RNA isolation-level, RT-level and PCR-level spike-ins from their all-sample average Cq values.29 Three spike-ins will be used at the RT level, and the average for the three will be used in these calculations. To identify the most invariant microRNA, NormFinder (with an addin provided by the algorithm developers at http://moma.dk/normfinder-software) will be used in Microsoft Excel 2011 in Mac OS X 10.6.8. Using this a list of microRNAs or ‘global mean’ summaries of microRNA Cq values that will be found to be least variant with cut-off stability value (higher value indicating higher variation) will be generated. Values for only the microRNAs detected in all samples will be used for this analysis. Based on above, two different normalised data sets will be generated: (1) spike-in-normalised as noted above; (2) global mean-normalised using intrasample mean for all the microRNAs detected in all samples (a given sample’s mean value was subtracted from all Cq values).
Inter-replicate correlation
Plots to show inter-replicate Spearman correlation coefficient values for the non-normalised (just processed data) or spike-in- or global mean-normalised data for replicate and non-replicate samples with their coefficient values and lines of identities (x=y) will be made. Only those microRNAs that are detected in both samples will be analysed. It is expected that the global mean normalisation method will yield data whose regression line overlaps the line of identity for the replicates for a good study.
Unsupervised hierarchical clustering and multidimensional scaling plots, heat-maps
In an unsupervised analysis, similarity/differences of microRNA profiles of different samples does not necessarily indicate an association with steroid resistance since other factors such as gender and medications may contribute. Hence, significant intergroup differences for the various clinical variables will be studied. Unsupervised hierarchical clustering assesses the closeness of overall microRNA expression among samples disregarding their group membership. Plots to show clustering using complete linkage values for Euclidean distances will be generated for non-normalised, spike-in normalised and globally normalised data. Multidimensional scaling (MDS), like clustering, is another way to represent data with a large number of variables in a simplified form.41 The MDS plots (drawn using Euclidean distances for data for all microRNAs or for the miRNAs that are expressed in all samples) will be drawn. This clustering and MDS plots approach is being adopted to visualise any clear separation of samples by group membership (disease condition) or lack of it. Finally heat-maps of the microRNA measurements for only those microRNAs that are detected in all samples will be generated using average linkages with Euclidean distance metric, and miRNA measurements will be Z-scaled across samples in order to visualise low expression levels of microRNAs in any group (SSNS/SRNS/healthy).
Differential expression analysis of miRNAs
For differential expression analyses, empirical Bayes-moderated t-statistics will be used in a t-like test as implemented in the limma Bio-conductor package for R.42 Non-normalised or normalised data will be used. Healthy children will be compared against SSNS, SRNS, all NS, all NS and SSNS or all NS and SRNS groups. Additionally, healthy and SSNS will be compared against SRNS and all NS. False discovery arising from multiple testing will be corrected by Benjamini-Hochberg method.43 Replicates will be excluded from this analysis.
For microRNAs for various comparisons for which raw p values are <0.05, only the microRNAs that are detected in >50% of the total number of samples in any given comparison will be considered and adjusted P (adj. P) values and log2 FC values (log2 ratio of group means) will be calculated. A separate analysis of microRNAs with raw (unadjusted) p value <0.10 will also be done in which all microRNAs will be considered, with or without replacement of NA values with a value between 39 and 42. The results of differential expression analyses depending on the type of normalisation and how the microRNAs are filtered for detectability will be tabulated. Assuming the global mean method to be the best normalisation method, microRNA with adjusted p value of <0.05 will be identified as with differentially expressed. Similarly, microRNA differences will be seen for various comparisons: control versus SSNS, control versus SRNS and SSNS versus SRNS. Tukey plots for the differentially expressed miRNA Cq value normalised with the global mean method will be represented.
The expression levels of miRNAs for qRT-PCR after normalisation will be calculated using the 2−ΔΔCt method.36 44 The non-parametric Mann-Whitney U test will be used to compare differences in variables between groups. For miRNAs, ROC curves and area under the ROC curve (AUC) will be used to identify their associations with NS. ROC curves and AUC will be established to evaluate the diagnostic value of serum miRNAs for differentiating patients with NS from healthy controls and SRNS from SSNS and healthy controls. In ROC analysis, the normalised expression level of miRNAs (2−ΔΔCt) will be selected as the test variable for the upregulated miRNAs, and for the downregulated miRNAs, the logarithm of the normalised expression level (2−ΔΔCt) will be selected as the test variable. In addition, forward stepwise binary logistic regression analysis will be conducted to evaluate the influences of miRNAs on steroid responsivenss in NS, controlling for other variables.
Finally, hierarchical clustering will be performed to visualise expression patterns of all miRNAs on qRT-PCR arrays. The normalised expression values will be log2 transformed, and unsupervised two-way hierarchical clustering will be performed using Euclidean distance and weighted average linkage Weighted Pair Group Method with Arithmatic Mean (WPGMA) to cluster miRNAs and samples simultaneously. Two-class unpaired significance analysis with multiple testing (10 000 permutations) will be used to identify miRNAs associated with steroid resistance using J-Express.45 The input for this analysis will be normalised, and log2 transformed and steroid resistance will be used as a response variable. The FDR expressed as q values <0.05 will be considered statistically significant. Overall steroid responsiveness will be calculated from date of enrolment until date of death or diagnosis of steroid resistance. To identify miRNAs associated with steroid responsive survival, univariate Cox proportional hazard regression will be applied to each miRNA, testing for associations with overall steroid responsiveness. To account for multiple testing, adjusted p values will be calculated by controlling the FDR, using the Benjamini-Hochberg procedure. Then, for all the miRNAs simultaneously, the LASSO method in the Cox proportional hazards model will be used to discover a set of miRNAs associated with the steroid resistance.
Bioinformatics analysis
The biological plausibility and significance of any group difference will be studied further by functional analyses. Whether any detectable difference reflects different amounts of microRNAs in general in the sera of the steroid-resistant cases due to reduced microRNA secretion or lesser stability of the circulating microRNAs or higher lipid levels inhibiting RNA isolation and/or RT-PCR would need further functional studies in future. In bioinformatics analysis to explore the functional annotation and pathway enrichment of the miRNAs in relation to NS, significant differentially expressed miRNAs will be analysed by bioinformatics functional algorithms. The candidate miRNAs will be imported into the miRWalk algorithm (http://www.umm.uniheidelberg.de/apps/zmf/mirwalk/) and potential targets of these miRNAs will be predicted using at least two microRNA target prediction databases algortihms (RNAhybrid and miRanda/TargetScan/DIANAmT/miRDB/PICTAR4/PICTAR5/PITA/RNA22). The Gene Ontology (GO) and Kyoto Encyclopedia of Genes and Genomes (KEGG) database analyses will be conducted using the Database for Annotation, Visualization and Integrated Discovery online analysis tool (http://david.abcc.ncifcrf.gov/tools.jsp), with a focus on the GO biology process feature. Fisher’s exact test and χ2 test will be used to select the significant GO category or KEGG pathway. Functional annotation will be performed by GO to determine the biological significance of these targets, and an p value calculated by the Fisher’s Exact Test to understand which functions are over-represented in the targets. Moreover, the KEGG pathway database will be searched for pathway analyses to identify the enriched pathways of targets.
Consent and recruitment
Witnessed written informed consent is being requested from all eligible patients or their next of kin (in case of patients with lower age group). Potentially eligible patients will be recruited from the outpatient department and ward of the participating centre.
Ethics and dissemination
The study is approved by Institutional Ethics Committee Army Hospital Research and Referral, Delhi Cantt dated 4 September 2014. Genomic data will be deposited in GEO at NCBI (http://www.ncbi.nlm.nih.gov/geo/) for further open access, and the study result will be published under an open access licence.
Current status of study
Sanction order for funding approval was received on 17 October 2016 and recruitment of cases for the study commenced with effect from January 2017. Recruitment is still ongoing and expected to be over by December 2018. Until 30 August 2018, 56 SRNS, 86 SSNS and 79 controls have been recruited with archiving of the biological samples.
Acknowledgments
We acknowledge our sincere thanks to Defence Research and Development Organization, Government of India, New Delhi, India, for funding support and Dr Santosh K Patnaik, Assistant Professor, Department of Thoracic Surgery, Roswell Park Cancer Institute, New York, for providing valuable inputs in designing the study protocol. We also acknowledge our sincere thanks to the Commandant, Army Hospital (R & R), Delhi Cantt-10 and Office of Director General of Armed Force Medical Services for providing permission to conduct the study.
References
Footnotes
Contributors SKP and PK have written and drafted the study protocol; PY and AM are research fellows, and MPY is collecting the samples for the study; TB and MK are the site coordinator. SKP is the principal investigator and contributed to designing and writing the study protocol. All authors read and approved the final manuscript.
Funding Armed Forces Medical Research Project 4831/2016 (Sanction order no. 15965/4831/2016/DGAFMS/DG-3B Dated 17-10-2016) funded by DRDO, Ministry of Defence, Government of India, New Delhi.
Competing interests None declared.
Ethics approval AHRR local ethics committee.
Provenance and peer review Not commissioned; externally peer reviewed.