Article Text

Abstract
Objective The aim of this study was to develop a predictive model using maternal, intrapartum and ultrasound variables for a composite of severe adverse neonatal outcomes (SANO) in term infants.
Design Prospectively collected observational study. Mixed effects generalised linear models were used for modelling. Internal validation was performed using the K-fold cross-validation technique.
Setting This was a study of women that birthed at the Mater Mother’s Hospital in Brisbane, Australia between January 2010 and April 2017.
Patients We included all term, non-anomalous singleton pregnancies that had an ultrasound performed between 36 and 38 weeks gestation and had recordings for the umbilical artery pulsatility index, middle cerebral artery pulsatility index and the estimated fetal weight (EFW).
Main outcome measures The components of the SANO were: severe acidosis arterial, admission to the neonatal intensive care unit, Apgar score of ≤3 at 5 min or perinatal death.
Results There were 5439 women identified during the study period that met the inclusion criteria, with 11.7% of this cohort having SANO. The final generalised linear mixed model consisted of the following variables: maternal ethnicity, socioeconomic score, nulliparity, induction of labour, method of birth and z-scores for EFW and cerebroplacental ratio. The final model had an area under the receiver operating characteristic curve of 0.71.
Conclusions The results of this study demonstrate it is possible to predict infants that are at risk of SANO at term with moderate accuracy using a combination of maternal, intrapartum and ultrasound variables. Cross-validation analysis suggests a high calibration of the model.
- fetal medicine
- imaging
- statistics
- epidemiology
This is an open access article distributed in accordance with the Creative Commons Attribution Non Commercial (CC BY-NC 4.0) license, which permits others to distribute, remix, adapt, build upon this work non-commercially, and license their derivative works on different terms, provided the original work is properly cited, appropriate credit is given, any changes made indicated, and the use is non-commercial. See: http://creativecommons.org/licenses/by-nc/4.0/.
Statistics from Altmetric.com
What is already known on this topic?
Both the estimated fetal weight and the cerebroplacental ratio are able to identify separate cohorts of ’at-risk' fetuses.
Individually, the estimated fetal weight and the cerebroplacental ratio are poor predictors of severe neonatal outcomes at term.
Predictive model diagnostic accuracies have been improved with the incorporation of maternal and intrapartum variables.
What this study hopes to add?
A model that combines maternal, intrapartum and ultrasound variables is able to predict serious adverse neonatal composite outcome with moderate accuracy.
The proposed model supports the incorporation of a late pregnancy ultrasound as part of routine antenatal care.
Dichotomising risk variables in any predictive model when there are significant linear associations with outcomes may improve model performance, though will miss cases that are close to the cut-off thresholds.
Introduction
Globally, hypoxia remains a major contributor to stillbirth, hypoxic ischaemic encephalopathy and cerebral palsy. For parents and families, the psychosocial and financial impact of these complications are profound and long-lasting. The majority of these catastrophic events occur despite a lack of obvious risk factors.1 This problem is significant and pressing, with the Royal College of Obstetricians and Gynaecologists, Gates Foundation, The Lancet and WHO urging focused research in this area. Indeed, a recent major 2017 UK report (‘Each Baby Counts’) of stillbirths, neonatal deaths and perinatal brain injury occurring has set an ambitious 50% reduction target by 2020.2
One prerequisite of any strategy to reduce adverse outcomes is the need to identify an at-risk population of fetuses. However, there is often lack of clarity of the population being screened and the perinatal outcomes chosen. Furthermore, clinically plausible and accurate interpretation of the relationship between risk variables and health outcomes is vital to ensure the robustness of any predictive model.3 The development of risk algorithms and predictive models using both ultrasound and demographic variables to enable risk stratification and individualised care is an increasing focus of research to reduce stillbirth and other adverse outcomes in high-income country settings.4 The accuracy of these models depends on careful consideration of the association between risk factors and outcomes, and importantly how these factors interact with and on occasion, confound each other.
The cerebroplacental ratio (CPR) is the ratio of the middle cerebral artery pulsatility index (MCA PI) divided by the umbilical artery pulsatility index (UA PI) and is now shown to be a possible marker of suboptimal fetal growth regardless of gestation.5–7 A low CPR is associated with a variety of adverse perinatal outcomes including stillbirth, intrapartum fetal compromise and acidosis at birth, a low Apgar score and neonatal unit admission regardless of gestational age or weight.8–11 The CPR is now increasingly being incorporated into clinical practice despite its relatively poor performance as a screening test for adverse perinatal outcomes.9 12–14 Previously, we have shown that both the CPR and estimated fetal weight (EFW) identified distinct at-risk cohorts and that a model incorporating both these factors improved the predictive capability for adverse perinatal outcomes.15 Others16 17 have used a larger number of variables including the CPR, fetal gender, parity, maternal age, EFW and gestational age at birth to develop models for prediction of adverse pregnancy outcomes.
The aim of this study was to develop a predictive model using a range of maternal, pregnancy, intrapartum and ultrasound variables for a composite of severe adverse neonatal outcomes (SANO) for term infants.
Methods
This study used information from clinical records of women that birthed at the Mater Mother’s Hospital in Brisbane, Australia between January 2010 and April 2017. The predictive model was developed using routine prospectively collected demographic, ultrasound, intrapartum and perinatal data.
We included all term (>37 weeks gestation), non-anomalous singleton pregnancies that had an ultrasound performed between 36 and 38 weeks gestation and had recordings for the UA PI, MCA PI and the EFW. Gestational age was determined using a first trimester ultrasound examination. Fetal biometry and EFW was measured and calculated using the formula by Hadlock et al.18
The following maternal demographic, pregnancy and birth variables were extracted for the analysis: maternal age, body mass index, ethnicity, parity, smoking status, alcohol consumption, use of illicit drugs, diabetes mellitus (gestational, type 1 or type 2), hypertension (gestational, chronic or pre-eclampsia), assisted reproductive techniques, induction of labour (IOL), fetal gender, mode of birth, gestational age at birth and socioeconomic index for areas (SEIFA) score. The SEIFA score is an Australian measure of an individual’s socioeconomic status where the average score is 1000 and a lower score represents relative socioeconomic deprivation.19
The components of the SANO were: severe acidosis (cord artery pH<7.0, lactate>6 mmol/L and/or base excess≤−12 mmol/L), admission to the neonatal intensive care unit, Apgar score of ≤3 at 5 min and/or perinatal death. Perinatal death was defined as stillbirth that occurred after >37 weeks gestation or neonatal death within 28 days of birth.
Statistical analysis
Due to the change in the mean and SD over gestation for the measures of the CPR, UA PI, MCA PI and EFW, z-scores were first calculated for each gestational age when the ultrasound scan was performed, using previously published reference centiles.20 21
Data measured on a continuous scale are reported as mean (SD). Proportions are reported as a percentage and number of observations. Mixed effects generalised linear models with a binomial distribution were used to account for the correlation of observations from women having more than one birth within the study period. Univariable analysis was performed and all variables with a p value <0.20 were included in the initial model. This was done in consideration of the prevailing consensus opinion that at least 10 events per variable are required to avoid overfitting the model.3 22 23
Model building was performed using the backwards stepwise approach as previously described by Sauerbrei et al.23 Variables were removed based on the highest p value and subsequent model improvement assessed through a decrease in the Akaike information criterion, a widely used criterion to assess model goodness of fit and parsimony.24 All variables removed were individually reinserted into the model and reassessed for any model improvement.
Receiver operating characteristic (ROC) curves, sensitivity, percentage of cases correctly classified, positive and negative likelihood ratios (PLR and NLR) and positive and negative predictive values (PPV and NPV) were used to evaluate the diagnostic accuracy of the final model.
Internal validation of the model was performed using the K-fold cross-validation technique using 50 folds.25 26 The number of SANO outcomes were compared with the number of SANO predicted by the model through the use of cross-tabulation of actual and predicted outcomes (aka confusion matrix) for the cross-validation model versus the original predictive model, and comparison of diagnostic accuracies using the original predictive model’s optimum threshold from the ROC curves.
Statistical analysis was performed using Stata statistical software, V.14 (StataCorp, College Station, Texas, USA).
Results
There were 5439 women during the study period that met the inclusion criteria, with 11.7% (639/5439) of this cohort having the SANO. Infants with the composite SANO were more likely to be born to women who were younger (30.3 vs 31.0, p=0.001), nulliparous (63.9% vs 43.4%, p<0.001), had lower SEIFA score (1011 vs 1018, p=0.03) and were less likely to be female (46.5% vs 50.9%, p=0.04). These women were more likely to be induced (54.5% vs 43.1%, p<0.001) and have an operative delivery (instrumental delivery [30.7% vs 10.8%] and emergency caesarean [25.7% vs 15.1%], p<0.001). For the ultrasound variables, fetuses in the SANO cohort had lower mean EFW (2911 vs 2976 g, p<0.001), lower mean CPR (1.93 vs 2.00, p<0.001) and higher mean UA PI (0.86 vs 0.83, p<0.001). There was however no difference in the mean MCA PI (1.59 vs 1.61, p=0.19). After standardisation, z-scores for the EFW (0.32 vs 0.45, p=0.01), CPR (−0.31 vs −0.13, p<0.001) and MCA PI (−0.23 vs −0.14, p=0.03) were all lower in the SANO cohort while the UA PI was higher (0.25 vs 0.07, p<0.001). There was no difference in the time from ultrasound to delivery between the two groups.
After univariable analysis, associations between the SANO and maternal age (OR 0.97, 95% CI 0.96 to 0.99, p=0.003), SEIFA score (OR 0.999, 95% CI 0.997 to 0.999, p=0.04), nulliparity (OR 2.50, 95% CI 1.89 to 3.13, p<0.001), IOL (OR 1.67, 95% CI 1.33 to 2.11, p<0.001) and female gender (OR 0.83, 95% CI 0.69 to 0.99, p=0.04) were identified. The composite outcome was also associated with instrumental birth (OR 5.97, 95% CI 3.52 to 10.13, p<0.001) and emergency caesarean (OR 3.28, 95% CI 2.26 to 4.76, p<0.001) as well as z-scores for EFW (OR 0.89, 95% CI 0.82 to 0.97, p=0.01), CPR (OR 0.83, 95% CI 0.75 to 0.91, p<0.001), UA PI (OR 1.20, 95% CI 1.09 to 1.32, p<0.001) and MCA PI z-score (OR 0.90, 95% CI 0.82 to 0.99, p=0.04) (table 1).
Demographics
The initial multivariable model consisted of maternal age, ethnicity, SEIFA score, illicit drug use, nulliparity, IOL, gender, method of birth, EFW z-score and CPR z-score. The UA PI and MCA PI z-scores were not included due to the association with the CPR z-score. Model selection was performed as previously described. The final generalised linear mixed model consisted of maternal ethnicity (Caucasian—reference, Indigenous [adjusted OR (aOR) 1.03, 95% CI 0.60 to 1.79, p=0.91], Asian [aOR 0.66, 95% CI 0.51 to 0.86, p=0.002], other [aOR 0.73, 95% CI 0.54 to 1.00, p=0.049]), SEIFA score (aOR 0.998, 95% CI 0.996 to 0.999, p=0.003), nulliparity (aOR 1.50, 95% CI 1.18 to 1.90, p=0.001), IOL (aOR 1.34, 95% CI 1.07 to 1.69, p=0.01), method of birth (spontaneous vaginal delivery [SVD] reference, instrumental [aOR 5.69, 95% CI 3.41 to 9.49, p<0.001], emergency caesarean [aOR 3.15, 95% CI 2.17 to 4.57, p<0.001], elective caesarean [aOR 1.33, 95% CI 0.94 to 1.88, p=0.11]) and z-scores for EFW (aOR 0.88, 95% CI 0.79 to 0.97, p=0.01) and CPR (aOR 0.88, 95% CI 0.79 to 0.98, p=0.02) (table 2).
Final model—severe adverse neonatal outcome
The final model had an area under the receiver operating characteristic (AUROC) curve of 0.71 (95% CI 0.69 to 0.73) (figure 1). Using a fixed false positive cut-off of 10%, the model demonstrated a sensitivity of 28.2% (95% CI 24.7 to 31.8), a PLR of 2.8 (95% CI 2.4 to 3.3) and NLR of 0.80 (95% CI 0.76 to 0.84). The PPV was 27.3% (95% CI 23.9 to 30.8), NPV of 90.4% (95% CI 89.5 to 91.2).
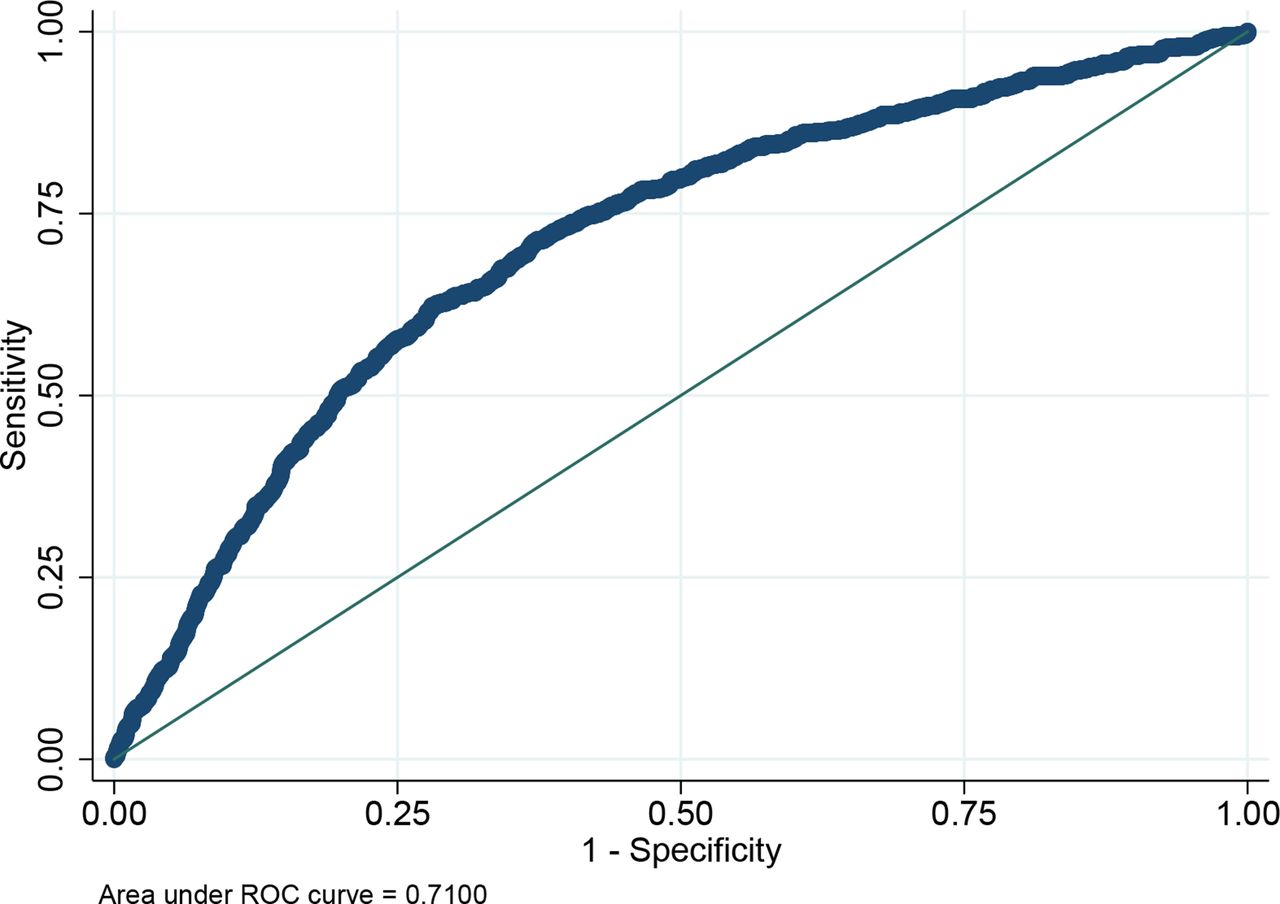
Receiver operating characteristics (ROC) for prediction of serious adverse neonatal outcome.
We also assessed the performance of the model in high-risk cohorts (EFW <10th centile and CPR <10th centile). Overall, there was negligible improvement in performance in any of the AUROC curves, but there was substantial improvement in the PPV for a cohort with an EFW <10th centile as well as those with both an EFW <10th centile and CPR <10th centile. There was also improvement in the PLR observed in the EFW <10th centile cohort (table 3).
Diagnostic evaluation
Cross-validation of the model showed accurate and robust performance of the model with little difference between the final model (AUROC curve 0.71, 95% CI 0.69 to 0.73) compared with the cross-validation model (AUROC curve 0.70, 95% CI 0.68 to 0.72) (figure 2). Confusion matrices of the comparisons of predicted and true outcome of the SANO for the final and cross-validation model can be found in table 4, with diagnostic accuracies presented in table 5.
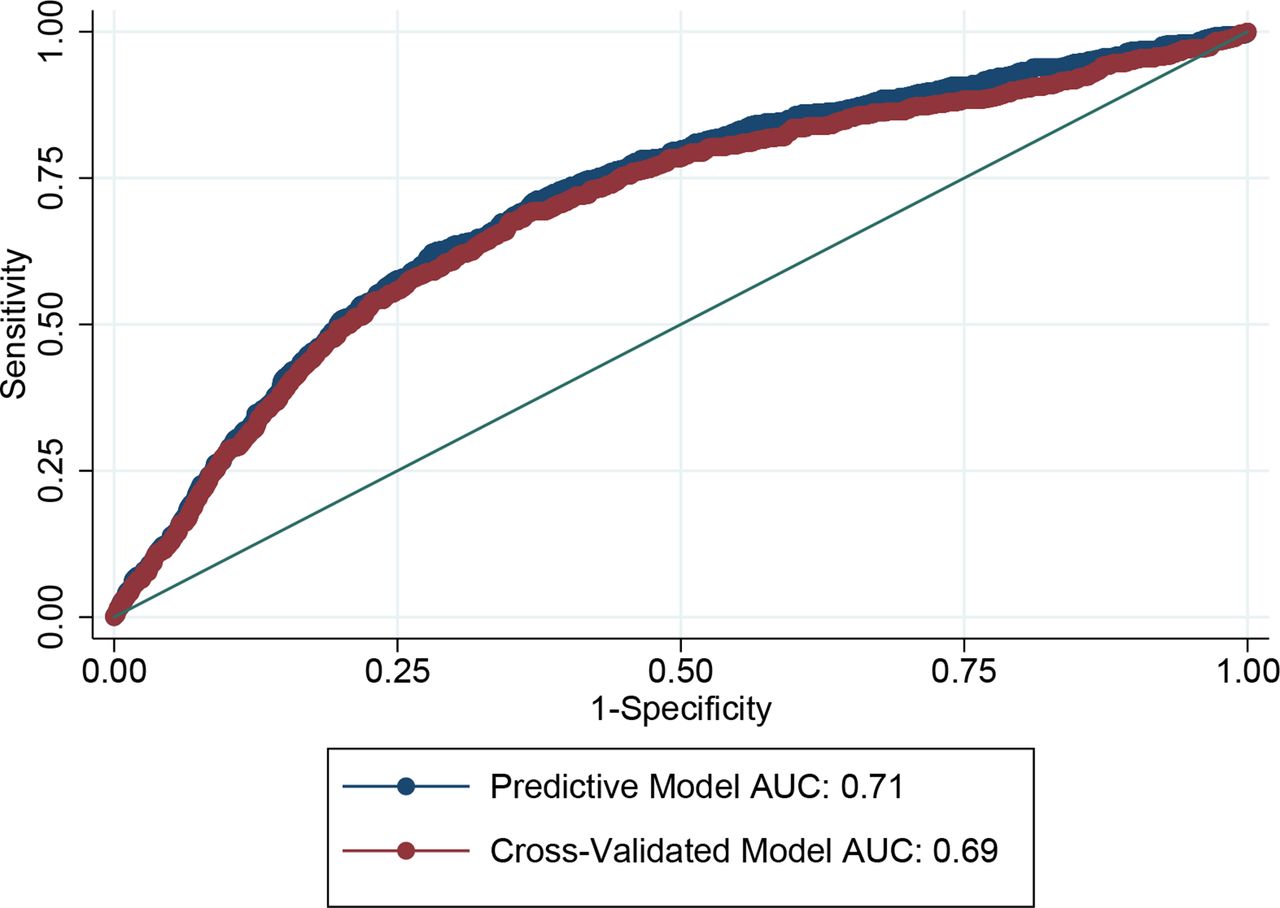
Comparison of predictive model and cross-validated model. AUC, area under the curve.
Cross-validation—confusion matrix
Cross-validation—diagnostic evaluation
Discussion
The results of this study demonstrate it is possible to predict with moderate accuracy, infants that are at risk of SANO at term using a combination of maternal, intrapartum and ultrasound variables. Cross-validation analysis suggests a high calibration of the model (table 4, table 5, figure 2).
There is increasing demand for a test to predict adverse late pregnancy outcome and the EFW and CPR are often being used to guide clinical management.9 11 13 17 27 We have previously shown that both these variables identify separate cohorts of infants at risk of SANO and emphasise the need to incorporate both in risk stratification models.15 In this paper, we extend our previous findings and use a variety of maternal, intrapartum and ultrasound-derived variables to develop a model for the prediction of a composite of adverse outcomes.
More complex predictive models have recently been developed to identify fetuses at risk of neonatal care unit admission and operative delivery for intrapartum fetal compromise, although in SGA cohorts.16 28 Evaluation of our model within high-risk cohorts (SGA or low CPR) saw an improvement in the PPV as well as the PLR but only a small increase in the AUROC. Our results demonstrate that the relationship between EFW as well as CPR and SANO is linear (illustrated in figure 3) and suggests that using a threshold to categorise a higher risk cohort (eg, EFW <10th centile) based on fetal weight will affect the accuracy of a model and fail to identify fetuses that have an increased risk when their weights are close to but do not exceed the threshold.29 Indeed, there is good evidence that the incidence of adverse outcomes including perinatal death rises when birth weight is <20th centile for gestation.30–32 Using a predictive model that incorporates risk factors as continuous variables is more reflective of the true ‘real-life’ relationship with adverse outcomes. While creating predictive models in high-risk cohorts using predetermined cut-offs may provide superficially more impressive model diagnostics, they are arguably misleading and may provide false reassurance for individuals that fall outside, but are very close to the cut-off threshold.29

Adjusted probabilities of serious adverse neonatal outcome for estimated fetal weight and cerebroplacental ratio z-scores. CPR, cerebroplacental ratio; EFW, estimated fetal weight; SANO, serious adverse neonatal outcome.
The strengths of this study lie in the large study cohort and development of a regression model which was not subjected to overfitting. We also chose components of the composite outcome to reflect poor condition at birth and the association with hypoxic birth injury which are important clinically relevant outcomes. These outcomes are also correlated with both short-term morbidity such as hypoxic ischaemic encephalopathy as well as long-term complications including cerebral palsy. We also used a reasonably contemporary cohort of women so that perinatal outcomes should not have been significantly influenced by evolution in obstetric or neonatal practices. Nevertheless, there are several limitations that must be acknowledged. Although the CPR was not reported, the EFW and UA PI were, which sometimes may have influenced management decisions. Furthermore, as routine late third trimester scans are not normally performed at our institution, by definition our study cohort cannot be truly considered an unselected or low-risk population. Although the AUROC curve for our model was good, the PLR was modest suggesting only a small increase in the likelihood of the outcome. When combined with a low pretest probability of adverse outcomes at term, the veracity and clinical utility of any model needs to be interpreted with caution.33
Clearly, any screening test has potential for harm from false positive or false negative results. During pregnancy, a positive screen result is often followed considerable maternal anxiety, increased obstetric intervention and early term birth. Indeed, there is evidence that children born at early term gestations have higher rates of neonatal complications34 35 and are at risk for long-term adverse neurodevelopmental sequelae.36–38 The low rates of serious outcomes for term births constrains the development of any screening test for use in the general obstetric population and clinicians need to be cognizant of the limitations of these tests. It is possible however, that the addition of placental biomarkers may improve the performance of such models.39 40 Despite the above-mentioned caveats, our model could be used to guide prenatal decision-making and may help guide clinical practice.
Patient and public involvement
There was no patient or public involvement in the research process.
Acknowledgments
The authors acknowledge research support by the Mater Foundation.
References
Footnotes
Contributors CF and SK conceived the study. CF, KG and CH designed the statistical analysis plan. CF prepared the data and carried out the analysis. CF and SK interpreted the results. VF assisted in the concept and interpretation. All authors drafted and finalised the paper.
Funding The authors have not declared a specific grant for this research from any funding agency in the public, commercial or not-for-profit sectors.
Competing interests None declared.
Ethics approval This study meets national guidelines set out by the National Health and Medical Research Council of Australia. Ethics approval was granted by The Mater Misericordiae Ltd Human Research Ethics Committee (reference number HREC/14/MHS/37).
Provenance and peer review Not commissioned; externally peer reviewed.
Data sharing statement The data used throughout this study are available from Mater Research but restrictions apply to the availability. Data were used under an agreement of confidentiality and privacy and therefore not available publicly. Data are available from the authors with privacy agreements and with permission from Mater Research. Statistical code is available from authors on request.
Patient consent for publication Not required.