Article Text

Abstract
Objectives To investigate the agreement between pulse oximetry (SpO2) and oxygen saturation (SaO2) measured by CO-oximetry on arterialised earlobe blood gas (EBG) in children and adolescents with sickle cell disease (SCD).
Design and setting We retrospectively reviewed 39 simultaneous and paired SaO2 EBG and SpO2 measurements from 33 ambulatory patients with SCD (32 subjects with Haemoglobin SS and one with Haemoglobin Sß+, 52% male, mean±SD age 11.0±3.6, age range 5–18). Measurements were performed between 2012 and 2015 when participants were asymptomatic. Hypoxaemia was defined as SaO2 ≤93%. A Bland-Altman analysis was performed to assess the accuracy of SpO2 as compared with EBG SaO2.
Results The mean±SD SpO2 and SaO2 values in the same patients were, respectively, 93.6%±3.7% and 94.3%±2.9%. The bias SpO2–SaO2 was −0.7% (95% limits of agreement from −5.4% to 4.1%) and precision was 2.5%. In 9/39 (23%) cases, the difference in SpO2–SaO2 was greater than the expected error range ±2%, with SaO2 more often underestimated by SpO2 (6/9), especially at SpO2values ≤93%. Thirteen participants (33%) were hypoxaemic. The sensitivity of SpO2 for hypoxaemia was 100%, specificity 85% and positive predictive value 76%.
Conclusions Pulse oximetry was inaccurate in almost a quarter of measurements in ambulatory paediatric patients with SCD, especially at SpO2values ≤93%. In these cases, oxygen saturation can be confirmed through EBG CO-oximetry, which is easier to perform and less painful than traditional arterial blood sampling.
- haematology
- respiratory
This is an open access article distributed in accordance with the Creative Commons Attribution Non Commercial (CC BY-NC 4.0) license, which permits others to distribute, remix, adapt, build upon this work non-commercially, and license their derivative works on different terms, provided the original work is properly cited, appropriate credit is given, any changes made indicated, and the use is non-commercial. See: http://creativecommons.org/licenses/by-nc/4.0/.
Statistics from Altmetric.com
What is known about the subject?
Accurate measurement of oxygen saturation is important in sickle cell disease (SCD).
Discrepancies in oxygen saturation have been shown between pulse oximetry and CO-oximetry on arterial blood samples in children with SCD.
What this study adds?
In clinically stable children with SCD, pulse oximetry does not accurately reflect haemoglobin saturation, especially at SpO2 values ≤93%.
In these cases, CO-oximetry on arterialised earlobe blood is an easier to obtain alternative to traditional arterial blood sampling.
Introduction
Sickle cell disease (SCD) is an inherited disorder of haemoglobin (Hb), characterised by recurrent episodes of acute illness related to red blood cells sickling and subsequent vaso-occlusion.1 Hypoxaemia is a predictor of vaso-occlusive pain2 and may be an early sign of acute chest syndrome (ACS)3; therefore, accurate measurement of arterial oxygen saturation is important to guide management in both ambulatory and emergency setting.4 The most accurate measure of oxyhaemoglobin is by CO-oximetry on arterial blood (SaO2), which is reliable in individuals with either predominant HbA or HbS.5 6 Minute-by-minute changes of oxygen saturation are detected with non-invasive pulse oximetry (SpO2) that shows a good correlation with CO-oximetry in individuals with normal Hb phenotype.7 However, people with SCD represent a different population in which previous small studies have shown some discrepancies between SpO2 and SaO2 measured by CO-oximetry.8–12 Treatment decisions in patients with SCD are often influenced by SpO2 findings, especially in the acute care setting where inaccuracies can result in misdiagnosis or mismanagement. For example, during an ACS episode, failure to detect hypoxaemia may delay the start of oxygen supplementation, which is a mainstay of supportive therapy.13 On the other hand, underestimation of oxygen saturation by SpO2 may lead the clinician to an inappropriate use of oxygen supplementation, with detrimental effects on erythropoiesis.14
Although arterial gas analysis with CO-oximetry is the gold standard to evaluate oxygen saturation in patients with SCD, the procedure is distressing and poorly tolerated in children. Measuring SaO2 by CO-oximetry on arterialised earlobe blood gas (EBG) is an alternative procedure that shows reasonable agreement with traditional arterial blood gas, especially for low arterial PO2 values that are more relevant in the clinical setting.15 16 The use of EBG in patients with SCD is attractive as it allows to reduce discomfort and pain17: a valuable target in population at risk of psychological complications related to the high burden of pain experienced.18
This retrospective study sought to investigate the agreement between SpO2 and SaO2 measured on EBG with CO-oximetry in ambulatory paediatric patients with SCD. We hypothesised that SpO2 would not be highly accurate in predicting SaO2. Since the presence of acute comorbidity might have affected these measurements, especially for SpO2 whose accuracy worsens when SaO2 is lower than 90%,19 we limited our analysis to patients who did not have acute symptoms at the time of evaluation.
Methods
We retrospectively reviewed our electronic database of patients with SCD aged 5–18 years with respiratory issues attending the paediatric respiratory clinic at King’s College Hospital, London, from 1 February 2012 to 1 August 2015. Evaluation of SaO2 through EBG with CO-oximetry, in addition to SpO2, represents a standard clinical practice in this clinic and it was routinely proposed to the attending patients. Those who accepted to undergo the EBG and had a successful measure of SaO2 were included in the analysis. Reasons for referral to the respiratory clinic were mainly asthma symptoms and sleep disordered breathing (eg, loud snoring, witnessed apnoeas, restless sleep and mouth breathing). Participants had simultaneous EBG with CO-oximetry and SpO2 measurements taken in room air during their visit. Only patients who had paired and valid EBG and SpO2 data taken during the same visit were included in the analysis. None of the subjects enrolled were suffering from SCD-related acute events (eg, painful crises, ACS, etc) at the time of evaluation. Pulse oximetry was performed using a Nonin GO2 pulse oximeter (Nonin, Plymouth, Minnesota, USA). SpO2 was recorded after at least 2 min of stable SpO2 readings and a clear pulsatile photoplethysmographic signal. EBG sampling was conducted at rest after 10–20 min of inactivity by an experienced operator. Rubefacient cream (thurfyl nicotinate) was applied to the earlobe in order to obtain local vasodilation and was left for 10 min prior to sampling. The rubefacient was then removed and the earlobe was rubbed vigorously with a gauze swab. Using a No. 15 Swann Morton scalpel blade, an incision was made in the ear lobe approximately 3 mm from the lower tip of the pinna to a depth of approximately 3 mm or deep enough to ensure free, rapid blood flow. After discarding the initial drop, the sample was collected in a preheparinised plastic capillary tube, taking care to avoid the formation of air bubbles. Samples were discarded if they contained air bubbles or if blood flow was slow or showed signs of clotting. Samples were immediately analysed using an ABL90 Flex blood gas analyzer with CO-oximetry (Radiometer Medical ApS, Denmark). SaO2, pH, PaO2 and PaCO2 values were recorded.
Data analysed in this study were collected at the time as part of standard clinical care.
This research was done without patient involvement
Patients were not invited to comment on the study design and were not consulted to develop patient relevant outcomes or interpret the results. Patients were not invited to contribute to the writing or editing of this document for readability or accuracy.
Power of the study and statistical analysis
Comparison of 36 SpO2 and 36 SaO2 measurements in the same patients would provide 80% power at the 5% significance level (two tails) to detect a difference of 2%7 between mean SpO2 (92%)20 and SaO2 (94%) with a SD=3% for both techniques. A Bland-Altman analysis was performed,21 computing the mean difference SpO2 – SaO2 (‘bias’) with the 95% limits of agreement (the interval of values within which 95% of the differences between SpO2 – SaO2 lie) and the SD of these differences (‘precision’). The expected bias between SpO2 and SaO2 according to most factures should be ≤2%, with precision of ≤4%.7 Hypoxaemia was defined as a SaO2 measured by EBG CO-oximetry ≤93%. This cut-off has been associated with pathophysiological and clinical consequences in patients with SCD and chronic hypoxaemia.22 23 In order to evaluate the accuracy of SpO2 to detect hypoxaemia, the sensitivity (the percentage of subjects with SpO2 ≤93% and SaO2 ≤93% of all subjects with an SaO2 ≤93%), specificity (the percentage of subjects with SpO2 >93% and SaO2 >93% of all subjects with an SaO2 >93%), positive predictive value (the percentage of subjects with SaO2 ≤93% of all patients with SpO2 ≤93%) and negative predictive value (the percentage of subjects with SaO2 >93% of all patients with SpO2 >93%) were calculated. A p value <0.05 was considered as statistically significant. Statistical analysis was performed with GraphPad Prism V.8.00 (GraphPad Software, California, USA).
Results
We analysed 39 simultaneous paired SaO2 and SpO2 readings from 33 children with SCD (boys 52%). Mean±SD age at the time of evaluation was 11.0±3.6 and distribution by ethnicity was 90% black African, 7% black Caribbean and 3% mixed Asian. Thirty-two participants were HbSS and one HbS/ß+. Almost half of the patients (48%, 16/33) were on hydroxyurea therapy and two patients were under chronic transfusion regime.
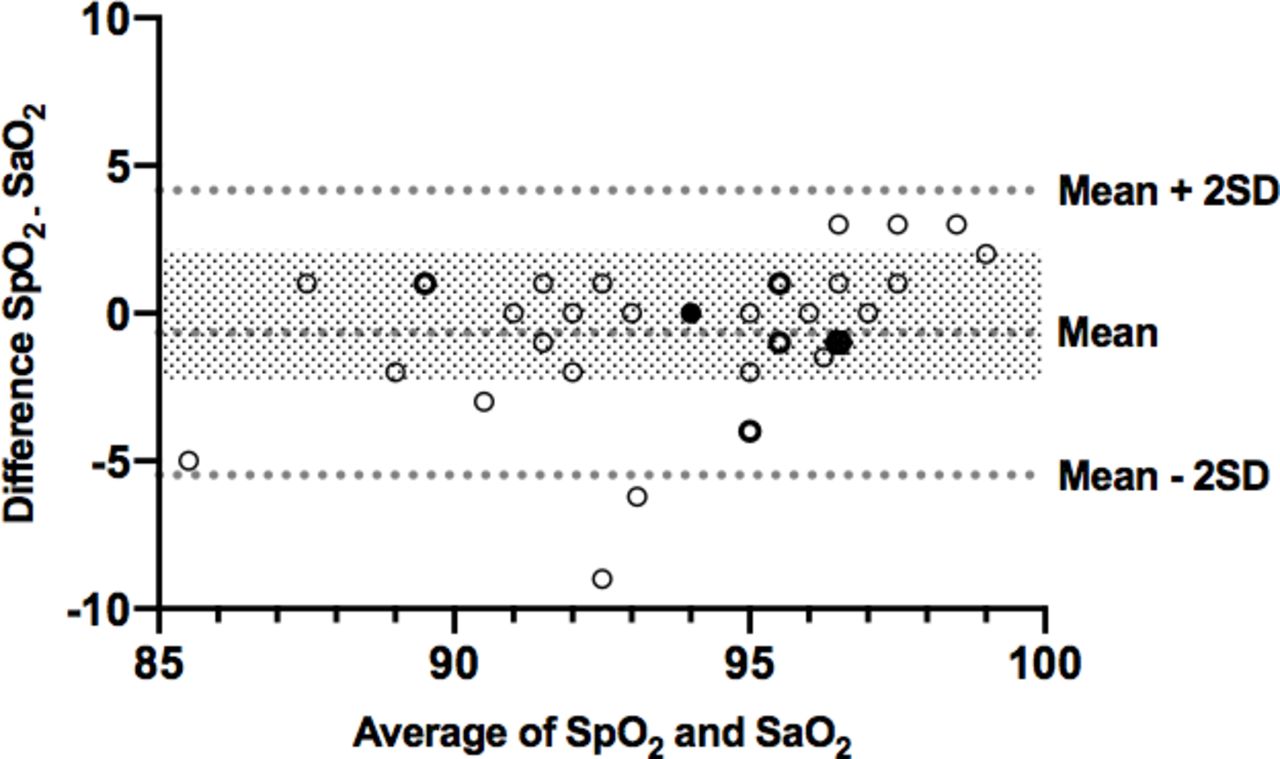
The mean±SD SaO2 was 94.3%±2.9% (range 87%–98%) and mean SpO2 was 93.6%±3.7% (range 83%–100%). A scatter plot of SaO2 versus SpO2 values from simultaneous records in each patient is represented in figure 1. The bias between SpO2 and SaO2 measured by EBG with CO-oximetry was −0.7% and the precision 2.5% (95% limits of agreement from −5.4 to 4.1; figure 2). In 23% of cases (n=9), difference SpO2− SaO2 was greater than expected bias of ±2%.7 Of these, in three patients, oxygen saturation was overestimated by SpO2 and in six underestimated (figure 2).

Scatter plot of 39 simultaneous earlobe blood gas SaO2 and SpO2 records in 33 patient with sickle cell disease aged 5–18 years. There are some overlapping values. The blank circles with normal border represent one observation, the blank circles with bold border represent two observations, the black circles indicate three observations and the black square four observations.
Bland-Altman plot showing the average values of simultaneous SaO2 by earlobe blood gas and SpO2 for each measurement in patient with sickle cell disease (X-axis) versus the differences (Y-axis). Broken lines indicates mean difference (−0.7%) and limits of agreement (−5.4 to +4.1%; mean±2 SD). Shaded region represents a difference of ±2%, which is the accepted error range for SpO2. A total of 39 paired measurements were plotted but only 30 points are visible, as there are some overlapping values. The blank circles with normal border represent one observation, the blank circles with bold border represent two observations, the black circles indicate three observations and the black hexagon four observations.
Thirteen participants (33%) were hypoxaemic (SaO2 ≤93% at EBG CO-oximetry), whereas a SpO2 ≤93% was found in 17 participants (43.5%). Among the 13 patients with SCD and SaO2 ≤93%, 12/13 (92%) had a partial pressure of oxygen (PaO2) >70 mm Hg, indicating a right-shifted oxyhaemoglobin dissociation curve (normally, for a given SaO2 of 93%, a PaO2 of 70 mm Hg would be expected).
The sensitivity of pulse oximetry to detect hypoxaemia (using EBG CO-oximetry SaO2 as standard) was 100% (95% CIs 77% to 100%), specificity 85% (95% CI 66% to 94%), positive predictive value 76% (95% CI 53% to 90%) and negative predictive value 100% (95% CI 85% to 100%).
Discussion
We evaluated the accuracy of pulse oximetry in predicting oxygen saturation as measured by CO-oximetry on arterialised capillary blood from the earlobe. Although the bias (mean difference) between SpO2 and SaO2 was low (−0.7%), we found that pulse oximetry was less accurate than expected (error range within ±2% compared with SaO2) in almost a quarter (9/39) of measurements in ambulatory paediatric patients with SCD.
The accuracy of capillary blood gas compared with arterial gas analysis has been mainly evaluated by studies performed in the intensive care setting and their results have been compared in a meta-analysis showing that EBG may be appropriate as a replacement for arterial SaO2, unless precision is needed (adjusted r2=0.88; mean bias=3.8 mm Hg).16 Interestingly from a clinical perspective, the meta-analysis showed that the accuracy of EBG in predicting arterial PaO2 improves in hypoxic conditions. Although there are no published data regarding the SCD population, the accuracy of EBG with CO-oximetry in this group is expected to be similar to that found in subjects without SCD.
Noticeably, the bias (−0.7%) and precision (2.5%) of SpO2versus SaO2 were lower than reported in previous studies comparing pulse oximetry and arterial blood gas with CO-oximetry in patients with SCD in both the acute8–10 24 25 and outpatient11 12 setting. Available evidence indicates conflicting data regarding the tendency of SpO2 to provide results higher or lower than SaO2 in the same patients, whereas in the present study SaO2 was more frequently underestimated (of at least 2%) than overestimated by SpO2 (figure 2). Inaccuracy of pulse oximetry was more pronounced at lower SpO2 values ≤93%, consistently with previous findings in adult patients with ACS9 and in outpatient children with SCD.11 This finding suggests that an SpO2 ≤93% in a child with SCD should be confirmed through a SaO2 assessment. We suggest this can be preferably done through EBG with CO-oximetry, in order to limit pain and discomfort for the patient.
Pulse oximetry did not miss any case of hypoxaemia (SaO2 ≤93%), but it provided some false-positive results (specificity 85%) and its positive predictive value for hypoxaemia was only 76%, further indicating the need to evaluate SaO2 in patients with SCD with SpO2 values in the hypoxaemic range (SpO2 ≤93%). A former study that adopted the traditional definition of hypoxaemia based on PaO2 ≤70 mm Hg (corresponding to SaO2 ≤93% in a normal oxyhaemoglobin curve) found that none of nine patients with SCD and SpO2 ≤93% had a PaO2 ≤70 mm Hg. Similarly, in our study, only 1 out of 17 participants with SpO2 ≤93% had a PaO2 ≤70 mm Hg, indicating that the oxyhaemoglobin dissociation curve was right shifted, with a lower SaO2 for a given PaO2 compared with a normal curve.24–26 In light of this evidence, we think that hypoxaemia in patients with SCD should be defined according to a SaO2 cut-off (as in the present study) rather than relying on PaO2 values, as SaO2 will better reflect the amount of oxygen that can be transported to the tissues (depending also on cardiac output, Hb concentration, etc).27
There are several factors that can contribute to unreliable pulse oximeter results in children with SCD. First, the oxyhaemoglobin dissociation curve tends to be right shifted when HbS polymerises.28 Moreover, dysfunctional Hb (carboxyhaemoglobin and methaemoglobin) are elevated in the presence of intravascular haemolysis and, since they adsorb light at similar wavelengths as oxygenated and deoxygenated, can affect SpO2 readings of convectional pulse oximeters.29 Furthermore, the high frequency of dark skin among patients with SCD can be an risk factor for poor accuracy of SpO2 in patients with hypoxaemia30 and, finally, accuracy of SpO2 is lower at SaO2 values <90%, a range of oxygen saturation often seen during ACS episodes.9
A strength of this study is that, to the best of the authors’ knowledge, is the largest comparison of SpO2 and SaO2 values in patients with SCD published so far and the first to have been specifically powered for this outcome. Moreover, this is also the first report of EBG with CO-oximetry in patients with SCD.
There were also several limitations. Accuracy of pulse oximeter was evaluated only in comparison to EBG with CO-oximetry, without performing arterial blood gas with CO-oximetry, which represents the gold standard. However, the acceptable agreement demonstrated between CO-oximetry performed on EBG and arterial blood samples16 should guarantee adequate reliability of the results. At this regards, we had a limited number of EBG SaO2 values <90% (6/39, 15%). As known from the literature30 and confirmed by our data (figure 2), the accuracy of pulse oximetry is poorer at these low oxygen saturation levels. The inclusion of a higher number of patients with hypoxaemia with SCD, for example, enrolling inpatients with acute clinical manifestations that have more often low SaO2, would have probably negatively affected the overall agreement between SaO2 and SpO2. However, including acutely ill patients would have been beyond the scope of this study that aimed to compare the use of EBG and pulse oximetry in an outpatient, non-critical, setting.
Hb values were not recorded at the time of oxygen saturation measurement, precluding the possibility of evaluating the relationship between SpO2 – SaO2 values and Hb concentration. The inclusion of patients with SCD with respiratory issues and the absence of individuals with acute comorbidity do not allow to extend the findings to the entire SCD population. Finally, due to the retrospective design, outcomes related to pain and acceptability of the EBG procedure in patients with SCD could not be evaluated.
Conclusions
Although the bias between SpO2 and SaO2 from arterialised earlobe gas analysis with CO-oximetry was rather small, pulse oximeter was inaccurate (differences at least ±2%) in almost a quarter of ambulatory paediatric patients with SCD, especially for SpO2 values≤93%. Clinician should be aware that when such low SpO2 values are detected in ambulatory patients with SCD, before taking major clinical decision based on these findings, they should be confirmed by an SaO2 assessment, due to the possibility of false-positive results. Evaluation of SaO2 in children with SCD can be performed, in alternative to traditional arterial blood sampling, through arterialised EBG with CO-oximetry that reduces pain and discomfort for the patient.16
Future studies should assess the agreement between pulse oximetry and arterialised EBG with CO-oximetry in patients with SCD acutely ill (ideally, also including the gold standard measure of SaO2 from arterial blood sampling), and whether the use of EBG in addition to SpO2 for evaluating oxygen saturation has any impact on clinical outcomes (length of hospitalisation, use of oxygen supplementation and requirement for non-invasive and invasive ventilation). Furthermore, it should be also evaluated if the use of EBG instead of arterial sampling for assessing oxygen saturation in acutely ill patients with SCD improves significantly the burden of pain and discomfort suffered during hospitalisation.
Acknowledgments
We adcknoweldge Mr Alan Lunt for his contribution to data collection.
References
Footnotes
Twitter @@Lungclinic
Presented at Partial results from the present study have been previously presented in form of abstracts at international meetings.
Contributors MA performed the analysis and wrote the manuscript. SZ designed the data collection instruments, coordinated and undertook data collection, contributed to the manuscript and approved the final manuscript as submitted. AL, GR, SC, CJB, DR reviewed and revised the initial manuscript, and approved the final manuscript as submitted. AG conceptualised and designed the study, reviewed and revised the initial manuscript, and approved the final manuscript as submitted.
Funding The authors have not declared a specific grant for this research from any funding agency in the public, commercial or not-for-profit sectors.
Competing interests None declared.
Patient and public involvement Patients and/or the public were not involved in the design, or conduct, or reporting, or dissemination plans of this research.
Patient consent for publication Not required.
Provenance and peer review Not commissioned; externally peer reviewed.
Data availability statement Data are available upon reasonable request. Deidentified participant data are available upon reasonable request to the corresponding author (atul.gupta@kcl.ac.uk)