Article Text

Abstract
Background The SARS-CoV-2 pandemic and initial public health response led to significant changes in health service delivery, access and utilisation. However, SARS-CoV-2 illness burden in children and young people (CYP) is low. To inform effective child public health interventions, we aimed to compare patterns of paediatric emergency department presentation during the initial pandemic response with a previous non-pandemic period.
Methods Retrospective review of attendances (0–18 years) over the initial pandemic (2 March 2020–3 May 2020) compared with 2019. Outcome measures included number of attendances, referral source, presenting complaint, discharge diagnosis and disposal. Descriptive statistics with subgroup analysis by age/sex/ethnicity and pandemic time periods (pre-lockdown, lockdown weeks 1–3 and lockdown weeks 4–6) was performed.
Results 4417 attendances (57% illness and 43% injuries) occurred, compared with 8813 (57% illness and 43% injuries), a reduction of 50%, maximal in lockdown week 2 (−73%). Ranking of top three illness presentations changed across the pandemic weeks. Breathing difficulty dropped from first (300, 25%) to second (117, 21%) to third (59, 11%) (p<0.001). Abdominal pain rose from the third pre-lockdown (87, 7%) and lockdown weeks 1–3 (37, 7%) to second in weeks 4–6 (62, 12%; p=0.004). Fever ranked second (235, 19%) in pre-lockdown and first in weeks 1–3 (134, 24%) and weeks 4–6 (94, 18%; p=0.035).
Conclusions Despite a 50% reduction, there was no significant change in acuity of illness. Rank of illness presentations changed, with abdominal pain ranking second and fever first, an important change from previous, which should prompt further research into causes. CYP-specific public health messaging and guidance for primary care are required in this second wave to ensure access to appropriate emergency services.
- COVID-19
- epidemiology
- health services research
This is an open access article distributed in accordance with the Creative Commons Attribution Non Commercial (CC BY-NC 4.0) license, which permits others to distribute, remix, adapt, build upon this work non-commercially, and license their derivative works on different terms, provided the original work is properly cited, appropriate credit is given, any changes made indicated, and the use is non-commercial. See: http://creativecommons.org/licenses/by-nc/4.0/.
Statistics from Altmetric.com
What is known about the subject?
Paediatric emergency attendances in the UK declined by more than 50% during the pandemic.
SARS-CoV-2 has a low burden of infection-related morbidity and mortality in children and young people (CYP) compared with adults.
Public health interventions and the impact of the pandemic led to significant disruption to health services providing acute and emergency care for CYP.
What this study adds?
Despite a 50% reduction in attendances, there was no significant change in proportion of illness and injury, acuity of illness, source of referral or disposal.
Ranking of presenting complaints changed unexpectedly with difficulty in breathing moving from first to third and an increase rank of fever and abdominal pain.
There was no apparent increase in presentations of CYP’s mental health or social problems to the emergency department.
Introduction
SARS-CoV-2 was declared a pandemic by the WHO on 11 March 2020. The pandemic has led to significant changes in health-seeking behaviours, influenced by public health messaging and reconfiguration of health services. The burden of SARS-CoV-2 in children and young people (CYP) is low1; however, there are ongoing concerns regarding the impact on the physical and mental health of CYP, including delays in seeking healthcare for non-SARS-CoV-2 illnesses.2–4
Initial public health messaging during the first wave focused on reducing the overall burden on health services to release capacity to manage patients with SARS-CoV-2 illness. Attendances to the paediatric emergency department (ED) were noted to decline considerably across the UK,5 6 Ireland7 and worldwide,8–11 while media campaigns urged the public to stay at home to reduce community-based transmission. Amid growing concerns that the national public health message would result in CYP being unable to access acute and emergency healthcare and therefore lead to increased non-SARS-CoV-2 mortality and morbidity in this age group, in June 2020, the Royal College of Paediatrics and Child Health published guidance for parents to highlight symptoms that warranted a medical review.12
Published data across the UK during the pandemic have focused predominantly on service use and have uniformly described a marked reduction in attendances but little change in acuity.5–7 A snapshot, opinion-based survey of paediatricians across the UK by the British Paediatric Surveillance Unit reported a delayed presentation rate of between 14% and 47% across the UK with diabetic ketoacidosis, sepsis, malignancy, appendicitis and child protection being the top five delayed presentations.3 A subsequent rapid UK multicentre service evaluation aiming to identify numbers of CYP with delayed presentations reported a low rate of delays with a low rate of hospital admissions within the delayed group.13 However, there is still a dearth of categorical quantitative data on the nature of acute illness presentations to the hospital during the pandemic and how this compares to previously described acute illness presentations. Medical presenting complaints at this particular ED have been previously well documented across a 20-year period.14 15
To understand how to provide appropriate access to services for CYP during a second wave and to inform effective public health interventions, we undertook a retrospective analysis of paediatric emergency attendances and presenting complaints during the initial phase of the SARS-CoV-2 pandemic in order to make a comparison with previously published patterns of presentation.
Methods
The pandemic was declared by the WHO on 11 March 2020. The UK announced a national lockdown on 23 March 2020.
The study was undertaken in the paediatric ED at the Queens Medical Centre, Nottingham, a tertiary major trauma centre which sees approximately 45 000 children annually. It is therefore assumed that the attendances studied are a sample of a wider population.
Data were collected retrospectively from the electronic patient record system for all paediatric emergency attendances over a 9-week pandemic time period from 2 March 2020 to 3 May 2020 compared with the same period in 2019. Data were collected on demographics, number of attendances, source of referral, presenting complaint, discharge diagnosis and disposal.
Descriptive statistics were used for analysis and included measurements of proportion and rank. Subgroup analysis by age, sex, ethnicity across both years and across pandemic time periods was also performed. The subgroup analysis of the 9-week pandemic period (pandemic weeks) was split into three groups of 3 weeks each: pre-lockdown, lockdown weeks 1–3 and lockdown weeks 4–6. Descriptive analyses, χ2 test, and Z test with Bonferroni correction were carried out to describe patterns of service use and to compare the differences of key measures among different subgroups or time periods as appropriate. All analyses were performed using IBM SPSS V.26.0 for Windows (IBM Corporation, Armonk, New York, USA). A p value or Bonferroni adjusted p value (unadjusted p values in each pairwise test multiplied by the total number of tests) of <0.05 was deemed statistically significant in all analyses.
Patient and public involvement
These data were collected to inform healthcare professionals and the public about presentation data during the COVID-19 pandemic. Due to the unprecedented, urgent need for the data, patients and the public were not involved.
Results
Cohort characteristics
The characteristics of the attendances are detailed in table 1. Young children aged under 5 years old accounted for the majority of attendances, which was similar across the two time periods as well as across pandemic weeks. Sex and ethnic groups were also proportionally similar across both time periods.
ED attendances by age, sex and ethnicity in 2019 and 2020 pandemic weeks
Attendances
There were 4417 attendances between 2 March 2020 and 3 May 2020, compared with 8813 in the same period in 2019, a reduction of 50%. By week, the greatest difference in attendances occurred in the second week of lockdown, where there was a 73% reduction compared with 2019 (figure 1).
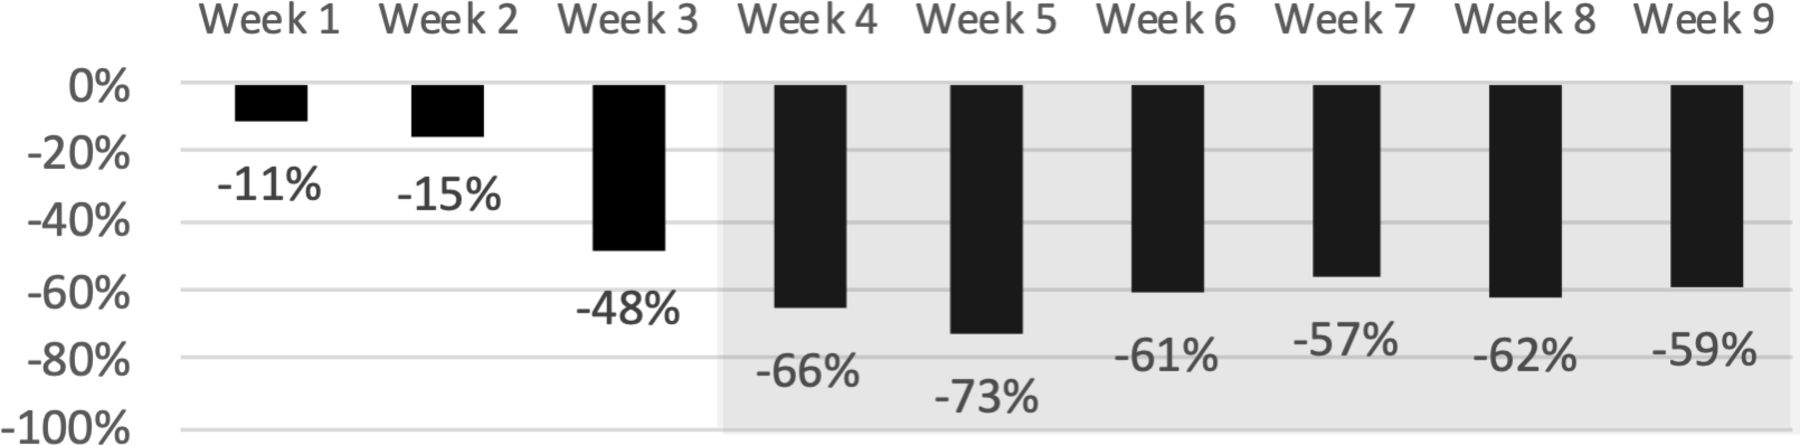
Percentage change in attendances over a 9-week pandemic period compared with the same period in 2019.
Presenting complaint
During the pandemic weeks, 2529 (57%) attendances were illnesses and 1868 (43%) were injuries, compared with 5005 (57%) and 3764 (43%), respectively, in 2019 (figure 2A). There was some change in the proportions of illness and injury presentations across pandemic weeks (figure 2B,C), which was not statistically significant overall (p=0.671).

Illness and injury presentations during the 2020 lockdown period and corresponding period in 2019. (A) Proportions of illness and injury by lockdown periods. (B) Proportions of illness presentations by week. (C) Proportions of injury presentations by week. (D) Change in absolute numbers and proportions of top three illness presentations by lockdown period. Shaded areas indicate national lockdown period (2 March–3 May 2020).
Illness presentations
The top five illness complaints were breathing difficulty, fever, abdominal pain, diarrhoea and vomiting, and rash, unchanged from 2019 and other historical published data.15
Ranking of the top three presentations differed across pandemic weeks (figure 2D). Breathing difficulty changed from first (300, 25%) to second (117, 21%) to third (59, 11%) in lockdown weeks 4–6, which was statistically significant (p<0.001). Abdominal pain ranked third pre-lockdown (87, 7%) and in lockdown weeks 1–3 (37, 7%), but second in lockdown weeks 4–6, increasing to 62 attendances (12%, p=0.004). Fever ranked second (235, 19%) pre-lockdown to first (134;24%) in lockdown weeks 1–3, to second (94;18%) in weeks 4–6 (p=0.035).
Mental health presentations
There were 54 (2%) attendances presenting with self-harm or suicidal thoughts during the pandemic weeks compared with 111 (2%) attendances in 2019; the ranking was the same (10th). There was 1 attendance with anxiety disorder, 5 attendances with depressive disorder and 2 attendances with hallucinations or delusions, compared with 11, 6 and 2 attendances, respectively, in the same period in 2019.
Social/safeguarding presentation
There were five attendances with a social problem in a medically well child during the pandemic weeks, compared with six attendances in the same period in 2019.
Triage category
A total of 88 (2%) attendances across the 9 weeks were triaged as a category 1 (CAT1) and 544 (12%) attendances as a category 2 (CAT2); this is compared with 146 (2%) and 1134 (13%) in the same period in 2019. There was no variation in CAT1 across pre-lockdown (2%), lockdown weeks 1–3 (2%) and lockdown weeks 4–6 (2%) and minimal variation in CAT2 (12%, 13% and 11%, respectively, across pandemic weeks), indicating no change in severity of presentations.
There was an increase in the proportion of category 3 overall (1051 attendances, 24%) during the pandemic weeks compared with 1389 attendances (16%) in same period in 2019. This proportional increase is due to a service reconfiguration during the pandemic where our ‘Out of hours’ GP service, which would be categorised differently, stopped seeing paediatric patients.
Looking at all presenting complaints (illness and injury, table 2), we found that the most common CAT1 presentation was seizure in 21 out of 88 attendances (24%), followed by breathing difficulty and head injury (14/88, 16%), fever (5/88, 6%) and injury of the lower limb (5/88, 6%). This is in comparison to the same period in 2019, where the most common CAT1 presentations were breathing difficulty (44/146, 30%), seizure (25/146, 17%), head injury (16/146, 11%), fever (7/146, 5%) and injury of the lower limb (6/146, 4%).
Top 10 presenting complaints in triage CAT1 and CAT2 in 2020 lockdown weeks and same period in 2019
Source of referral
Of 4417 attendances, 3065 (69%) were by self-referral across the pandemic weeks, which were proportionally the same as those in 2019 (6149/8813, 70%). Emergency services/urgent care were the second most common source of referral for 487 (11%) attendances during the pandemic weeks which was similar to 2019 (762/8813, 9%). NHS111 referral ranked third (416/4417, 8%), and GP ranked fourth (315/4417, 7%). This was different from 2019, where GP referral ranked third (755/8813, 9%) and NHS111 ranked fourth (734/8813, 8%).
Discharge diagnosis
Table 3 describes the top 10 illness discharge diagnoses. Upper respiratory tract infection (URTI) was the top-ranked illness discharge diagnosis overall (357 attendances, 16%) and remained top across the pandemic periods (18%, 16% and 10%), unchanged from 2019 (591 attendances, 14%). The second most common illness discharge diagnosis overall was tonsillitis (120 attendances, 5%) compared with infectious gastroenteritis in the same period in 2019 (386, 9%). Bronchiolitis ranked third overall affecting 105 (5%) attendances in the pandemic period, with the same ranking in 2019 affecting 9% of attendances. Infectious gastroenteritis ranked fourth overall in the pandemic period affecting 101 attendances (5%), whereas tonsillitis ranked fourth in 2019 (161, 4%).
Top 10 illness discharge diagnoses in 2019 (4098 attendances) and 2020 pandemic weeks (2240 attendances)
Asthma ranking changed considerably, ranking 20th during the pandemic period, compared with ninth in the same period in 2019.
During the pandemic weeks, coronavirus was recorded as the discharge diagnosis (presumed) which ranked 15th.
For mental health presentations, paracetamol overdose was the discharge diagnosis in 39 (2%) attendances in pandemic weeks compared with 66 (2%) in 2019. The ranking (11th) remained the same. Other overdoses combined (opiate, benzodiazepines non-steroidal anti-inflammatory drugs and antidepressant) were diagnosed in 21 attendances, the same as in 2019. Depressive disorder was the discharge diagnosis in 17 (1%) attendances compared with 33 (1%) in the same period in 2019. Anxiety disorder was the discharge diagnosis in 16 (1%) attendances, compared with 34 (1%) in 2019.
Safeguarding concern was the discharge diagnosis in five attendances, compared with eight in 2019, and social problem was the diagnosis in two attendances compared with five in 2019.
Disposal
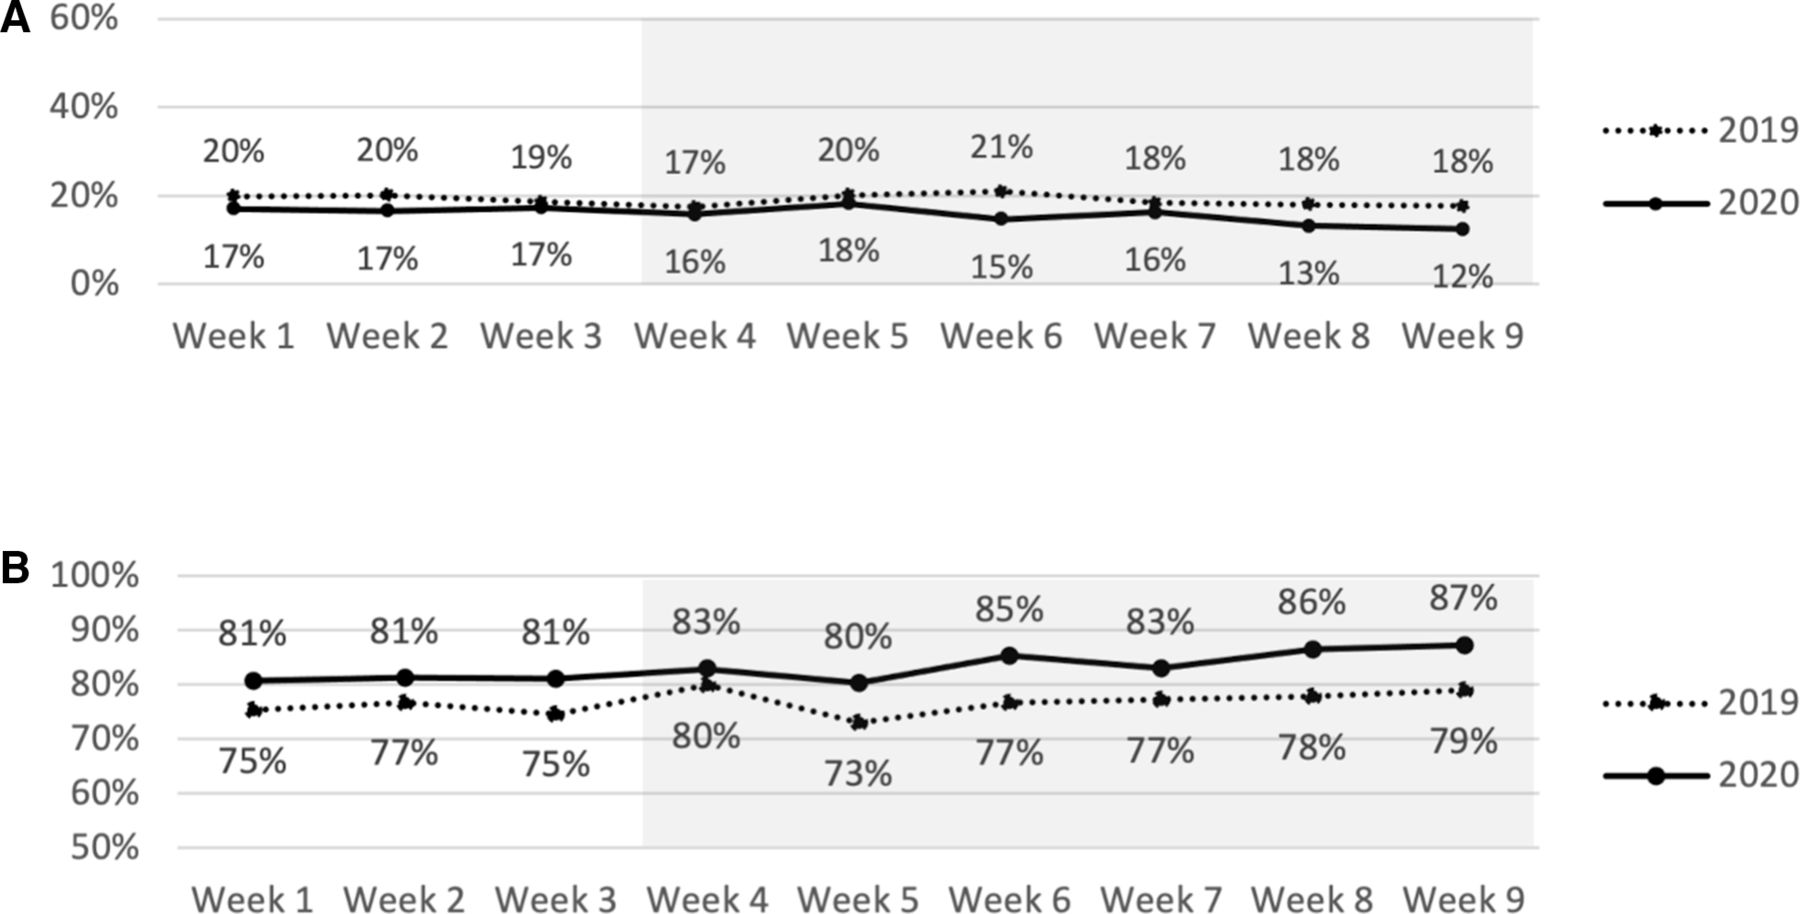
A total of 708 (16%) attendances resulted in admission to the hospital; 3647 (83%) were discharged; 61 (1%) did not wait; and 1 patient died during the pandemic period. This was compared to 1675 (19%) of attendances resulting in admission, 6755 (77%) being discharged, 383 (4%) who did not wait and no deaths in the same period in 2019. There was minimal variation in admissions and discharges across pandemic weeks (figure 3).

Proportions of admissions and discharges by weeks compared with the same period in 2019. (A) Admissions. (B) Discharges. Shaded areas indicate national lockdown period (2 March–3 May 2020).
Discussion
This observational study compares a 9-week period of the SARS-CoV-2 pandemic and the first 6 weeks of lockdown to the same period in 2019. There was a significant reduction in the number of attendances to the ED, which correlates with other published literature worldwide.5–10 The reason for this is likely to be largely due to public health messaging instructing the public to ‘stay at home, protect the NHS, save lives’,16 as well as the fear of contracting the illness from the hospital and the indirect consequences of staying at home. There was little change in the acuity of attendances, namely, the severity of illness, sources of referral and disposal.
Overall, the top five medical presenting complaints of breathing difficulty, fever, abdominal pain, diarrhoea and vomiting, and rash remained the same as reported previously when taking into account the change in coding at this ED of breathing difficulty to include cough.15 The change in rank of these symptoms across the pandemic weeks is interesting, given that breathing difficulty has consistently been top across decades and has been increasing14 15; fever became the most common complaint in weeks 1–3 of lockdown, which could be due to government messaging highlighting fever as a symptom of coronavirus. Abdominal pain, a recognised mode of presentation in CYP with acute COVID-19, became the top presenting complaint in lockdown weeks 4–6. The cause for this change in presentation pattern is unclear and may relate to reduced transmission of other viral infections or reduction in air pollution in lockdown or that SARS-CoV-2 illness predominantly causes fever and abdominal pain presentations in CYP. It is certainly worthy of further evaluation to understand how the burden of both SARS-CoV-2 and non-SARS-CoV-2 illnesses in CYP changes during a pandemic.
The numbers of CYP we saw with mental health presentations reduced despite published data to suggest that mental health symptoms were higher in young people during the pandemic.17 18 This is worrying as there are no data currently to suggest they were presenting elsewhere, although it is important to quantify numbers seen by CAMHS at the time.
With regard to the ranking of discharge diagnoses, upper respiratory tract infection and bronchiolitis remained the top diagnoses despite lockdown measures. Infectious gastroenteritis changed from second to fourth, likely due to reduced number of cases secondary to better hand washing as promoted through the key public health messaging. Asthma diagnoses ranked 20th, down from 9th, which is a probable reflection of reduced pollution, infectious transmission and allergic precipitants. While COVID-19 ranked 15th, it is important to note that this discharge diagnosis was presumed as the swab was taken in the department with no confirmed result available.
While the numbers of CYP with a safeguarding or social concern declined slightly, the numbers are too small to draw any conclusions as to whether this is anything other than a normal variation.
Strengths and limitations
The strength of this study is the depth of data from a large tertiary trauma centre, whose medical presenting problems have previously been studied in detail prior to the pandemic.14 15 This is the first original paper to our knowledge describing not only service use but also presentations in the UK.
The generalisability of these data from a single centre is difficult to ascertain; however, this is a large tertiary centre and the findings correlate with other published data during the pandemic regarding reduced attendances and minimal change in acuity in the presentation of CYP. These data do not span the post lockdown period, but nevertheless cover the most pertinent period and reflects the need to disseminate the data promptly to add to knowledge regarding a new, rapidly emerging picture. Future service evaluation would be recommended spanning the post lockdown period and into the second wave to assess any further changes in health-seeking behaviour or presentations especially given the effect that normal winter pressures will inevitably have during the second wave of the pandemic.
Implications for practice
These findings show that unlike in adults, CYP were still presenting with the same complaints without real change in severity of presentation, although in significantly reduced numbers. While these findings provide some reassurance that CYP were still able to access acute healthcare during the initial phase of the pandemic, it still does not tell us what happened to the CYP who did not attend. We must be mindful that the second wave of this pandemic is taking place over winter when paediatric emergency attendance rates usually increase. The public health measures taken to reduce community transmission in the second wave have also been modified, including keeping children in education and increased access to community SARS-CoV-2 testing and contact tracing. Therefore, the impact of a second wave on acute illness presentations may be modified.
Primary care has had to change the way in which they deliver care with telephone or video consultations becoming the norm. There is a risk here that those CYP who present with non-specific, non-acute symptoms are not examined by a healthcare professional, which could have an impact on those attending emergency services for advice.
Public health messaging during this second wave should be clear and include advice for CYP and families about when and how to access paediatric emergency care. There is also an urgent need for professional bodies to collaborate to provide up-to-date guidance for primary care on thresholds for seeing CYP face-to-face in this new era of virtual consultations to ensure that they receive appropriate acute or emergency care.
Acknowledgments
The authors thank Kosma Szychowski-Nowak and Mike Christopher at Nottingham University Hospitals NHS Trust, who helped to extract relevant data from the electronic patient record.
Footnotes
Twitter @HeadSmartFellow
Contributors DS, DW, CG, LS and J-FL designed the study. CG and DS collected the data. J-FL performed the data analysis. DS, J-FL and DW wrote the manuscript. All authors approved the final manuscript as submitted.
Funding The authors have not declared a specific grant for this research from any funding agency in the public, commercial or not-for-profit sectors.
Competing interests There are no competing interests.
Patient and public involvement Patients and/or the public were not involved in the design, conduct, reporting or dissemination plans of this research.
Patient consent for publication Not required.
Ethics approval This service evaluation project was reviewed and approved by the Caldicott Guardian at Nottingham University Hospitals NHS Trust.
Provenance and peer review Not commissioned; externally peer reviewed.
Data availability statement Data relevant to the study are included in the article. Additional data are available upon reasonable request.