Article Text

Abstract
Objective The aim of this study was to explore spatiotemporal distribution of under-five mortality in Ethiopia using data from four (2000, 2005, 2011 and 2016) consecutive demographic and health surveys.
Methods A total of 41 498 children were included from four consecutive Ethiopian Demographic and Health Surveys. The geospatial analysis was conducted by using ArcGIS V.10.7 and saTScan V.9.6. Thus, spatial autocorrelation, hotspot analysis, spatial interpolation and spatial scan statistics were carried out for each survey separately to show the temporal pattern of geographically risk areas of under-five mortality in Ethiopia. Finally, the most under-five mortality rate (U5MR) risk areas in each survey period were mapped.
Results Under-five mortality was spatially clustered in Ethiopia (Moran’s Index: 0.046–0.096, p<0.01). The Benishangul-Gumuz region was consistently at a higher risk in the last two decades. Additional hotspot areas were detected at Afar and Amhara (in 2000, 2005, 2016), at Gambala (in 2011) and the South Nation Nationality and People’s (SNNP) Region (in 2016). Moreover, 160 primary clusters were identified. Of these, 85 clusters (log-likelihood ratio (LLR)=13.10, p<0.01) were from Benishangul-Gumuz and Amhara regions (in 2000); 67 clusters (LLR=12.93, p<0.01) were from Afar and Amhara regions (in 2005); 4 clusters (LLR=10.54, p<0.01) were from Benishangul-Gumuz region (in 2011); and another 4 clusters (LLR=11.85, p<0.01) were from Afar region (in 2016).
Conclusion High-risk areas were detected mainly in the Benishangul-Gumuz and Afar regions. As a result, designing under-five population targeted intervention programmes in those high-risk geographical regions was vital to reduce under-five mortality in Ethiopia.
- epidemiology
- statistics
- health services research
Data availability statement
Data are available in a public, open access repository. The datasets we used for this study were publicly available at http://www.dhsprogram.com.
This is an open access article distributed in accordance with the Creative Commons Attribution Non Commercial (CC BY-NC 4.0) license, which permits others to distribute, remix, adapt, build upon this work non-commercially, and license their derivative works on different terms, provided the original work is properly cited, appropriate credit is given, any changes made indicated, and the use is non-commercial. See: http://creativecommons.org/licenses/by-nc/4.0/.
Statistics from Altmetric.com
What is known about the subject?
The under-five mortality was a major public health problem in Ethiopia. In previous studies, the prevalence of under-five mortality and socioeconomic and sociodemographic factors that affect under-five mortality were assessed.
What this study adds?
The under-five mortality had spatial dependency over the last 20 years in Ethiopia. The hotspot (high risk) areas were mainly detected in Benishagul-Gumuz across four surveys. Besides, Amhara, Afar, Gambela and South Nation Nationality and People’s Region were at higher risk of under-five mortality.
Introduction
Although there has been a substantial reduction in the under-five mortality rate (U5MR), in 2018, more than 15 000 children died before celebrating their fifth birthday. Globally, the U5MR is 39 deaths per 1000 live births but there is a stark difference between developing and advanced countries. The sub-Saharan Africa and central and southern Asia accounted for more than 80% of the 5.3 million under-five deaths in 2018. Current evidence shows that Saharan countries have a very high U5MR (ie, 78 deaths per 1000 live births). This is 1 child in 13 dies after surviving the first month before his or her fifth birthday. This is 16 times higher than the average ratio of 1 in 199 in high-income countries.1 2 Ethiopia is among the five countries which account half of all global under-five deaths in 2018,2 with the U5MR of 67 deaths per 1000 live births.3 Despite progressive and consistent health intervention, U5MR shows the highest trend in Ethiopia.4–6
In the Sustainable Development Goal 3 (SDG 3), the targets for neonatal mortality and U5MR are specified to be less than 12/1000 live births and 25/1000 live births, respectively.7 Furthermore, the target was extended to the elimination of preventable child deaths between birth and age 5 by 2030. Thus, the SDG framework requires giving attention to subgroups that may be missed from traditional measurement systems.8 9
Previously, different studies were conducted on under-five mortality in Ethiopia.10–20 However, these studies mainly focused on assessing the factors associated with under-5 mortality without statistically investigating its spatiotemporal distribution. Thus, there is a literature gap on the spatial pattern and spatiotemporal distribution of under-five mortality across regions in Ethiopia.
Spatiotemporal distribution analysis is key for understanding the geographical risk areas of under-five mortality by showing the specific location of the risk areas over time. The basic assumption of spatial analysis goes to Tobler’s first law which focuses on the notion that near things are more related than distant ones.21 Toblers first law states that “everything is related to everything else, but near things are more related than distant things’’. This concept is considered as the core of spatial autocorrelation statistics (for analysing correlation relative to distance or connectivity relationships). Moreover, it is central to every spatial analytical techniques as well as analytical conceptions of geographic space.22
Consequently, the evidence that under-5 mortality might be concentrated in an area over time is vital to assess the public health impact of maternal and child health intervention programmes applied so far. Besides, it will provide input for future health planning by identifying high priority areas. Therefore, the objective of this study was to assess the spatiotemporal distribution of under-5 mortality and whether the distribution has changed significantly overtime in Ethiopia by using data from four consecutive large national surveys.
Methods
Patient and public involvement
This study used a publicly available dataset (Ethiopian Demographic and Health Survey (EDHS) 2016); therefore, there were no patients or members of the public directly involved.
Study design and setting
The data from four consecutive EDHS (2000, 2005, 2011 and 2016) were used for this study. The surveys were conducted at 5-year interval cross sectionally at the national level. Ethiopia is an East African country that is located at the horn of Africa (figure 1). The country is administratively subdivided into nine regional states such as Afar, Amhara, South Nation Nationality and People’s (SNNP) Region, Benishangul-Gumuz, Gambela, Harari, Oromia, Somalia, Tigray and two city administrations (Addis Ababa and Dire Dawa).

Map of Ethiopia where the four surveys were conducted. (Source: Shapefile from Central Statistical Agency, Ethiopia, 2013.)
Data source and sampling
Each Demographic and Health Survey adopted a two-stage stratified sampling technique based on the population and housing census sampling frame designed to collect data at the national, zonal, state and rural–urban levels during previous censuses.3 In the first stage, clusters or enumeration areas (EAs) were selected with probability proportional to population size. A total of 540, 540, 624 and 645 EAs (clusters) were selected in 2000, 2005, 2011 and 2016, respectively. The second stage involved the systematic sampling of households in each selected cluster. Thus, total samples of 14 642, 14 645, 17 817 and 18 008 households were selected in 2000, 2005, 2011 and 2016 surveys, respectively. In all surveys, a reproductive age (15–49) women were interviewed about the survival status of their children. As a result, data on the sex, month and year of birth, number of births, current age (if the child is alive) and age at death (if the child is dead) were collected. For the current study, a total of 41 498 children were extracted from four surveys and included in the analysis (table 1). Additional information about the sample selection and data structure can be obtained from each EDHS reports available on https://dhsprogram.com/. The EDHS sample weights were applied during analysis.
The total number of study participants and the year of the survey
The georeferenced data were also taken from selected EAs in each survey. For the current study, the survey datasets and location data were accessed through the web page of the international DHS Programme after justifying the purpose of accessing data and after being an authorised user.
Spatial analysis
ArcGIS V.10.1 was used for spatial analysis. The spatial autocorrelation (Global Moran’s I) statistic measure was used to evaluate whether the under-five mortality patterns are dispersed, clustered or randomly distributed in the study area. Moran’s I is a spatial statistics used to measure spatial autocorrelation by taking the entire dataset and produce a single output value that ranges from −1 to +1. A positive value for Moran’s Index indicates a clustered pattern of the under-five mortality, while a negative value for Moran’s Index indicates a dispersed pattern and under-five mortality is distributed randomly if I value is zero.23 24
Gettis-OrdGi* statistics was conducted to detect further the local level risk areas of U5MRs in Ethiopia during different periods. In this analysis, Z-score and p value were computed to determine the statistical significance of clustering.25 If the Z-score falls outside the range, the observed spatial pattern is probably too unusual to be the result of random chance, and the p value would be small to reflect this. In this case, figuring out what might be causing a statistically significant spatial pattern in the data is considered. Statistical output with high Gi* indicates ‘hotspot’ (high-risk areas) of U5MR, whereas low Gi* shows a ‘cold spot’ (low-risk areas) of U5MR in Ethiopia.23 24 26
The unsampled areas of Ethiopia were also predicted by using data from sampled locations through the spatial interpolation technique.27 Of different interpolation techniques, the Ordinary Kriging spatial interpolation method was used to predict and produce smooth surfaces of U5MR risk areas.
Furthermore, to detect the local specific risk areas (clusters) of U5MR, spatial scan statistics (the method widely recommended to detect local clusters because of its higher power than other available spatial statistical methods) was used.28 Therefore, spatial scan statistical analysis was employed to test for the presence of statistically significant spatial hotspots/clusters of U5MR using Kuldorff’s saTScan V.9.6 software.29 It was used to classify statistically important under-five mortality hotspot areas. The spatial scan method uses a circular window that moves across the map and at each position; the radius of the circular window varies repeatedly from 0 up to a set maximum radius of 50 which restricts the maximum size of the window from exceeding 50% of the total study population. In this study, under-five children who died were taken as cases, whereas those who were alive were taken as controls to fit the Bernoulli model. The numbers of cases in each location have binomial distribution and a maximum spatial cluster size of <50% of the population was used as an upper limit.
Result
Spatial distribution of under-five mortality
The proportion of under-five mortality varied across regions in all surveys. The highest U5MR was observed in Benishangul-Gumuz region throughout the surveys. In 2000 survey, the highest U5MRs (260–420 deaths per 1000 live births) were observed in Benishangul-Gumuz, Afar Amhara, Tigray and Gambela regions (figure 2A). The U5MR which ranges from 240 to 440 deaths per 1000 live births occurred again in Benishangul-Gumuz, Afar, Tigray, Amhara and Oromia regions in 2005 (figure 2B). Furthermore, in 2011 and 2016, the highest U5MR occurred in Benishangul-Gumuz, Afar, southeast Amhara and SNNP Region (figure 2C,D).
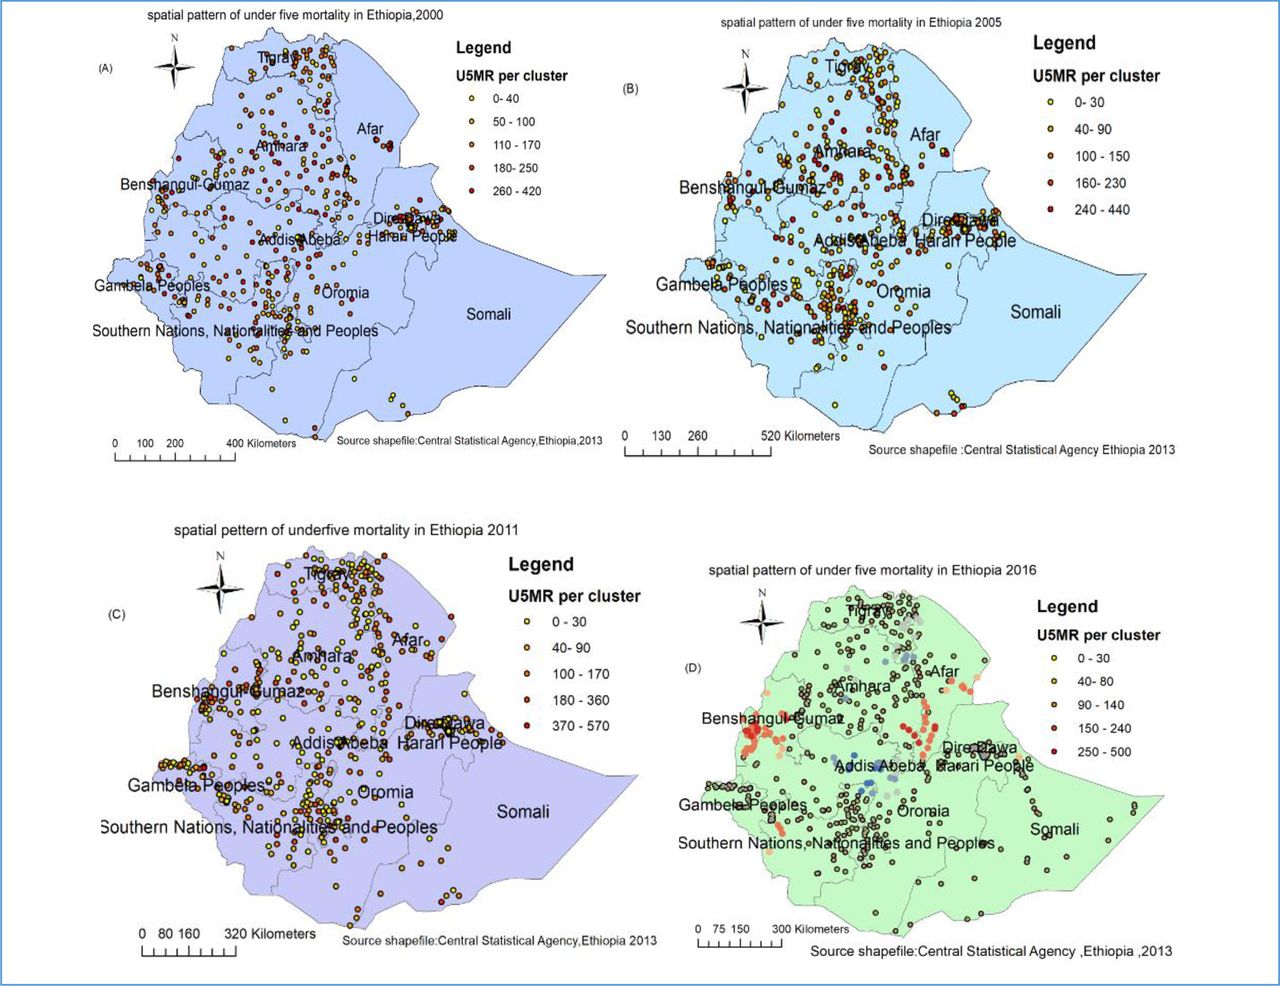
Spatial distribution of under-five mortality in Ethiopia: 2000 (A), 2005 (B), 2011 (C) and 2016 (D) .
The spatial clustering of under-five mortality
Results of the Global Moran’s I show a statistically significant positive spatial autocorrelation of U5MRs in Ethiopia in all surveys. Based on 2000 and 2005 surveys, results showed that U5MRs had statistically significant positive spatial autocorrelation (MI=0.05, p=0.00 and MI=0.05, p=0.00, respectively). The Z-score of 3.9 and 3.0, respectively, also indicated a clustered pattern (figure 3A,B, table 2). Whereas, in 2011 and 2016, the results indicate a statistically significant relatively strong spatial autocorrelation of overall U5MRs in Ethiopia (MI=0.09, p=0.00 and MI=0.096,p=0.00, respectively). Besides, the Z-scores of 5.45 and 6.49, respectively, also indicated a clustered pattern (figure 3C,D, table 2).

Spatial autocorrelation of under-five mortality in Ethiopia: 2000 (A), 2005 (B), 2011 (C) and 2016 (D).
Spatial autocorrelation analysis of under-five mortality in Ethiopia: 2000, 2005, 2011 and 2016
Hotspot analysis
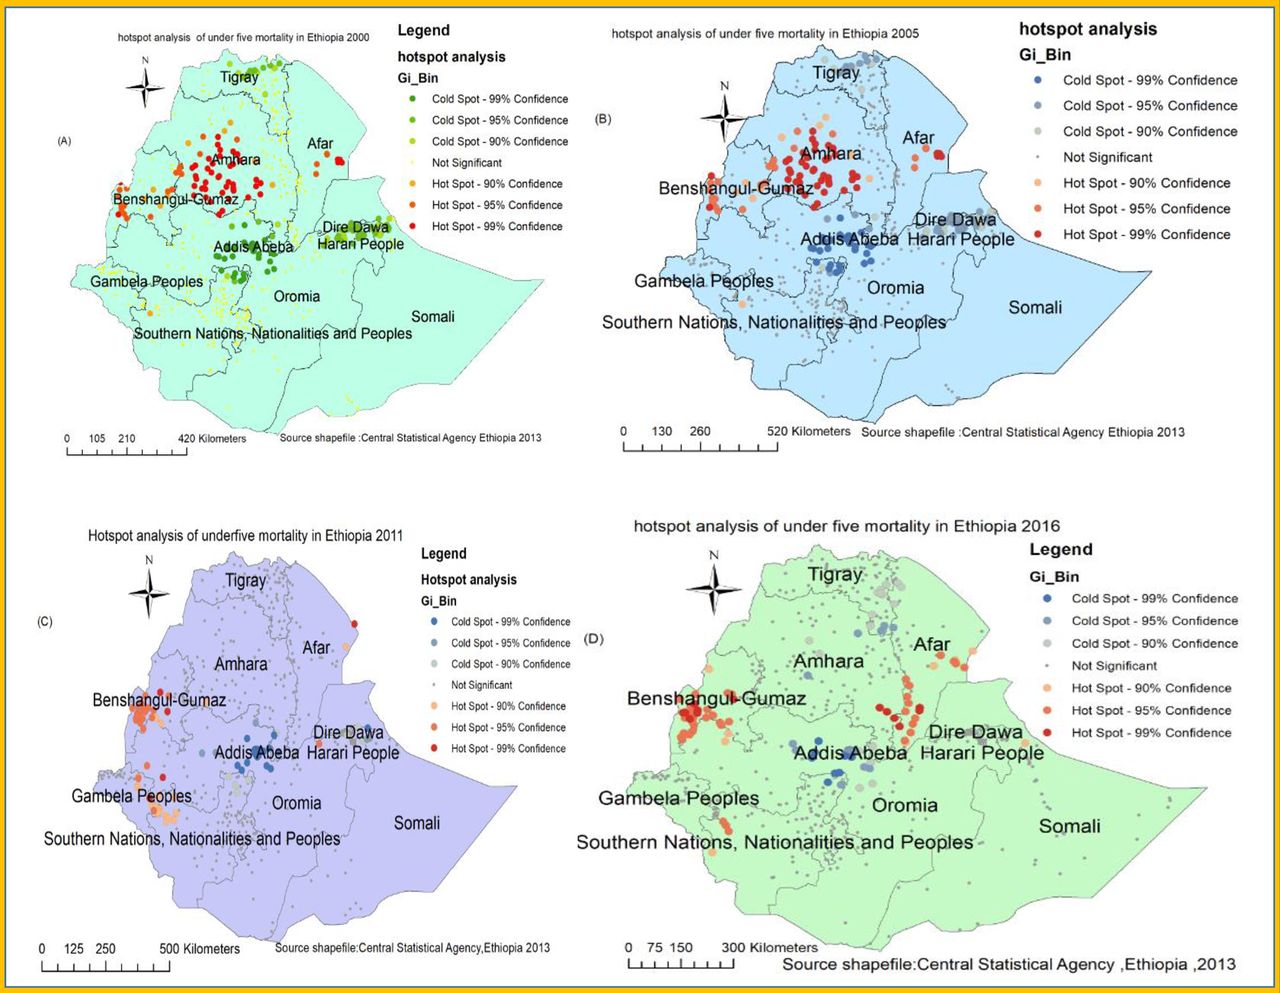
Figure 4 shows the hotspot areas of under-five mortality in Ethiopia over the last two decades. The spatial clustering of under-five mortality was consistently observed at the Benishangul-Gumuz region in all surveys (figure 4). Moreover, Amhara and Afar regions in 2000 and 2005; Afar, Gambela, SNNP and Oromia in 2011; Afar, southeast Amhara and SNNP regions in 2016 were high-risk areas of under-five mortality.

Hotspot analysis of under-five mortality in Ethiopia: 2000 (A), 2005 (B), 2011 (C) and 2016 (D).
Spatial scan analysis
Overall, a total of 160 most likely (primary) clusters were detected across four surveys. Of these, 85 significant primary clusters were identified in 2000. The spatial scanning window for these clusters was located in southeast Amhara and the southern part of the Afar region. It was centred at 10.927588 N, 40.208008 E with a radius of 224.45 km, a relative risk (RR) of 1.36 and a log-likelihood ratio (LLR) of 13.10 at p value <0.01 (table 3, figure 5A). It showed that the children within the spatial window had a 1.36 times higher risk of death before 5 years of age as compared with children outside the spatial window.

Spatial scan statistics of under-five mortality in Ethiopia: 2000 (A), 2005 (B), 2011 (C), 2016 (D).
Most likely clusters of under-five mortality in Ethiopia: 2000, 2005, 2011 and 2016
Whereas, in 2005, a spatial scan statistics detected a total of 67 primary clusters. The spatial window was located in the southern Amhara and eastern part of Benishangul-Gumuz region. It was centred at 10.754969 N, 37.924294 E with a radius of 192.84 km, an RR of 1.56 and LLR=13.93, p value<0.01 (table 3, figure 5B). The children within this spatial window had a 1.56 times higher risk of death before celebrating their fifth birthday as compared with children outside the spatial window.
Furthermore, a total of eight (four in each survey) primary clusters were identified in the 2011 and 2016 surveys. The spatial window for the 2011 survey was shifted to the Benishangul-Gumuz region which is centred at 10.205226 N, 34.769722 E with a radius of 19.42 km, RR of 3.29, LLR of 10.54 at p value<0.01 (table 3, figure 5C). The risk of death before 5 years of age among the children within this spatial window was 3.29 times higher as compared with children outside the spatial window. Whereas the spatial scanning window for 2016 was detected in the southern Afar region which is centred at 13.750028 N, 39.991261 E with a radius of 16.33 km, the RR of 3.17, LLR of 11.85 at p value <0.01 (table 3, figure 5D). Children within this spatial window had a 3.17 times higher risk of death before 5 years of age as compared with children outside the spatial window.
Spatial interpolation
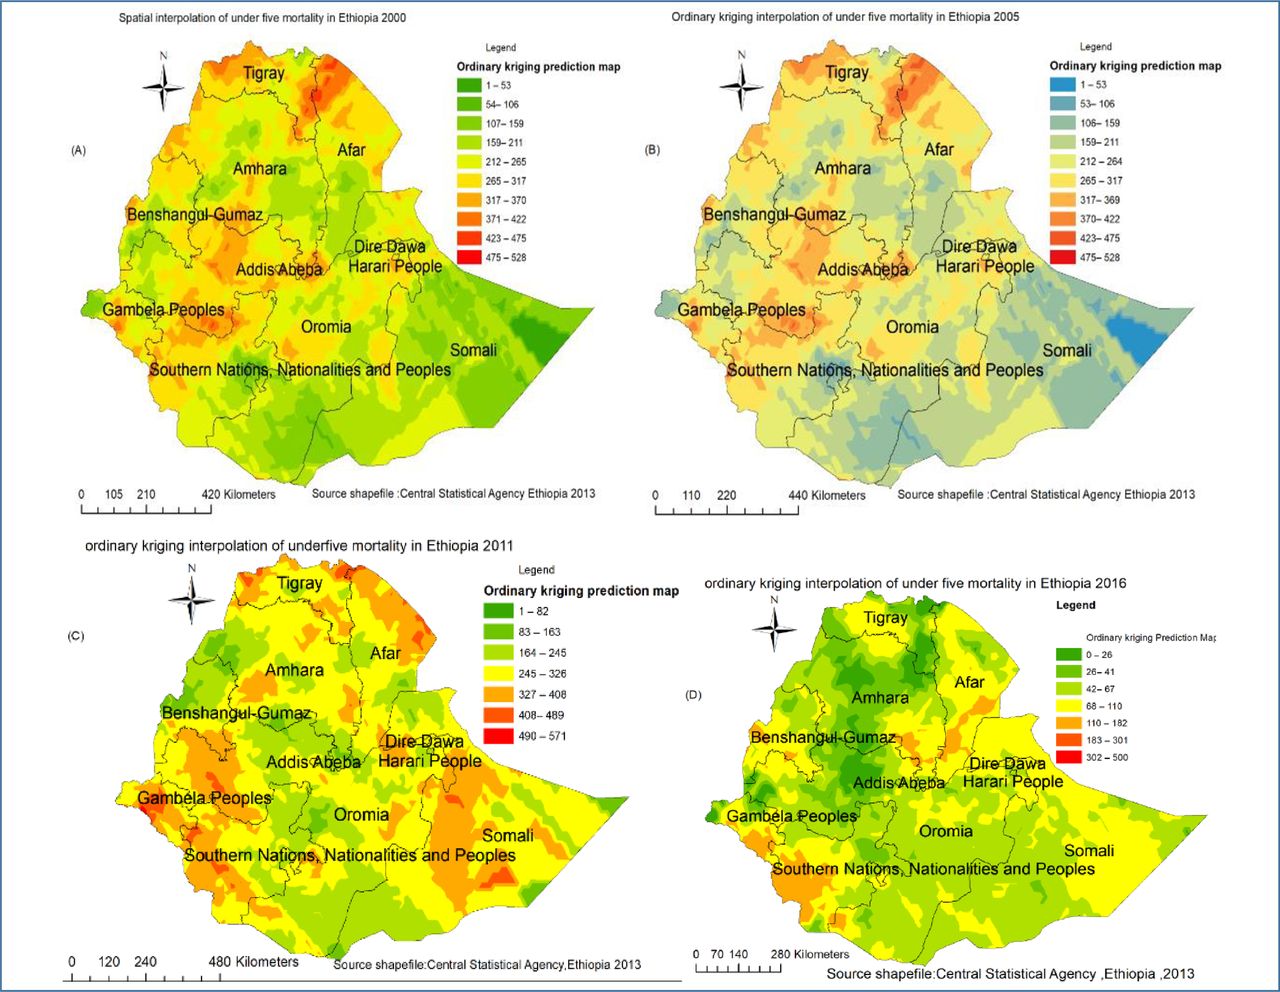
In 2000 and 2005, the Afar (Eastern part), Tigray (north) and Oromia (west) regions were predicted as a more risky area of under-five mortality as compared with other regions (figure 6A,B). Whereas in 2011 and 2016, the risk was shifted to Afar, Gambela, Somali, SNNP and Benishangul-Gumuz regions (figure 6C,D).
Spatiotemporal interpolation of under-five mortality in Ethiopia: 2000 (A), 2005 (B), 2011 (C), 2016 (D).
Discussion
Under-five mortality is a health indicator and a critical measure of human development.30 Its disparities within developing countries account for roughly half of the global gap between developed and developing countries. Thus, the evidence showed that within-country inequities deserve as much consideration as do inequalities between the world’s developing and developed regions.31 Thus, the current study identified the geographic variations of risk areas of under-five mortality which could provide an insight for policy makers.
The spatial autocorrelation analysis result indicated that U5MR had a spatial dependency in 2000, 2005, 2011 and 2016 (Moran’s I: 0.046, 0.047; 0.09 and 0.096, respectively at p value 0.01). This result is supported by the findings in Nigeria32 33 and Bangladesh.34 The spatial heterogeneity of under-five mortality clustering was detected mainly in Benishangul and Afar regions. These might be due to difficulty to access the health services in remote areas, shortage of safe and adequate drinking water supply, low altitude (lowland) and endemicity of malaria.35 36 As it was indicated in the hotspot analysis result (figure 3), the spatial clustering of under-five mortality was more or less consistently observed in the Benishangul-Gumuz region during four surveys. The possible justification could be a high multidimensional child deprivation index (MCD) where 89% of children are deprived in three to six dimensions in the Benishangul-Gumuz region. Deprivation in sanitation and housing are the largest contributors to the MCD index where Benishangul-Gumuz ranks among the most deprived regions in those two dimensions which may affect child survival.37 This might be because the majority of population in Benishangul-Gumuz region lives in the remote area. Consequently, there might be poor maternal and child health service utilisation which could lead to child deprivation in different aspects.38 Furthermore, the evidence on the determinants of child mortality in Benishangul-Gumuz indicated that the economic inequality and education is related to under-five mortality.39
Identifying the most likely clusters was very vital especially in resource-limited areas to prioritise risk areas for intervention. Hence, the spatial scan statistical analysis method performs very well in detecting local clusters and has higher power than other available methods.28 As a result, a total of 160 most likely (primary) clusters were detected across four surveys in spatial scan analysis. These clusters were primarily from Afar, Benishangul-Gumuz and Amhara regions (figure 5).
These findings have valuable policy implications for intervention and programme design. The hot spot areas of under-five mortality can be detected at local administrative levels. Generally, these findings are supremely important for the Ministry of Health and Regional Health Bearus to give attention to those hot spot areas to have good progress towards achieving sustainable development goal target for under-five mortality.
As a strength, the study used data from a nationally representative large dataset, which results in adequate statistical power. Besides, the sampling weight was applied to produce reliable estimates. However, it has the following limitations. First, the location data values were shifted 1–2 km for urban and 5 km for rural areas for data confidentiality issues. This may affect the exact location of cases. Second, spatial modelling was not conducted to identify the spatial determinants in those risk areas. Finally, the variation of the population in each year could introduce bias during assessment of the spatiotemporal distribution of under-five mortality.
Conclusion
Under-five mortality remains a public health problem and had spatial dependency over the last 20 years in Ethiopia. The hotspot (high risk) areas were detected in Benishagul-Gumuz across four surveys. Besides, Amhara, Afar, Gambela and SNNP regions were at higher risk of under-five mortality. As it was indicated by spatial scan statistics findings, most likely clusters were again detected in Afar, Amhara and Benishangul-Gumuz regions.
Therefore, public health intervention activities designed in a targeted approach to impact high-risk populations as well as geographic regions were vital to narrow the U5MR in Ethiopia.
Data availability statement
Data are available in a public, open access repository. The datasets we used for this study were publicly available at http://www.dhsprogram.com.
Ethics statements
Ethics approval
We requested DHS Programme and permission was granted to download and use the data for this study from http://www.dhsprogram.com. The Institution Review Board approved procedures for DHS public-use datasets do not in any way allow respondents, households or sample communities to be identified. There are no names of individuals or household addresses in the data files. The geographic identifiers only go down to the regional level (where regions are typically very large geographical areas encompassing several states/provinces). Each enumeration area (Primary Sampling Unit) has a PSU number in the data file, but the PSU numbers do not have any labels to indicate their names or locations. In surveys that collect GIS coordinates in the field, the coordinates are only for the enumeration area (EA) as a whole, and not for individual households, and the measured coordinates are randomly displaced within a large geographic area so that specific enumeration areas cannot be identified.
Acknowledgments
The authors would like to thank measure DHS for their permission to access the DHS datasets.
References
Footnotes
Contributors All authors contributed to data analysis, drafting or revising the article, have agreed on the journal to which the article will be submitted, gave final approval of the version to be published and agree to be accountable for all aspects of the work.
Funding The authors have not declared a specific grant for this research from any funding agency in the public, commercial or not-for-profit sectors.
Map disclaimer The depiction of boundaries on this map does not imply the expression of any opinion whatsoever on the part of BMJ (or any member of its group) concerning the legal status of any country, territory, jurisdiction or area or of its authorities. This map is provided without any warranty of any kind, either express or implied.
Competing interests None declared.
Patient and public involvement Patients and/or the public were not involved in the design, or conduct, or reporting or dissemination plans of this research.
Provenance and peer review Not commissioned; externally peer reviewed.