Article Text

Abstract
Objective This research evaluated (1) differences in body size and composition of Tasmanian infants at birth and 3 and 6 months postpartum compared with WHO child growth standards and (2) body composition changes in Tasmanian infants at the extremes of the weight-for-length (WFL) spectrum.
Design Observational study.
Setting A hospital in Northern Tasmania, Australia.
Patients 315 healthy infants (~90% Caucasian) born between 2017 and 2019 in Tasmania.
Interventions Body composition and anthropometric measures at 0, 3 and 6 months.
Main outcome measures Growth characteristics at birth and growth trajectories from 0 to 6 months were compared against WHO child growth standards for 0–2 years.
Results Overall, growth of Tasmanian infants in the first 6 months of life was similar to the global prescriptive standards. Trajectories of fat mass (FM) and fat-free mass (FFM) accrual in infants from the extremes of the size spectrum appear to converge at the 6-month time point. Infants in the lower extremity demonstrated the most precipitous accrual in percentage FM (and the steepest decline in percentage FFM), compared with all other infants.
Conclusion No significant deviations of growth were observed in Tasmanian infants from 0 to 6 months in comparison to the WHO prescriptive growth standards. Infants below the third percentile WFL showed the most precipitous increase in FM accretion. Periodic comparisons local infants with global standards will enable identification of significant deviations from optimal growth patterns.
- obesity
- neonatology
Data availability statement
All data relevant to the study are included in the article or uploaded as supplementary information.
This is an open access article distributed in accordance with the Creative Commons Attribution Non Commercial (CC BY-NC 4.0) license, which permits others to distribute, remix, adapt, build upon this work non-commercially, and license their derivative works on different terms, provided the original work is properly cited, appropriate credit is given, any changes made indicated, and the use is non-commercial. See: http://creativecommons.org/licenses/by-nc/4.0/.
Statistics from Altmetric.com
What is already know on this topic?
Optimal growth assessment in early life is critical as it can minimise the potential for erroneous diagnosis of undernutrition/overnutrition.
Tasmania has one of the highest rates of obesity in Australia, but anthropometric profiles of Tasmanian newborns have not been evaluated against the current WHO standards.
Numerous countries have reported deviations in average height and weight in different national and ethnic groups compared with the WHO child growth standards.
What this study adds?
Growth of this select cohort of Tasmania infants is consistent with the WHO child growth standards.
The inclusion of body composition assessment can help identify distinct growth patterns among infants with under- or overweight.
Given the inevitability of secular changes in growth patterns, it will also be important to recalculate and update these comparisons periodically.
Introduction
Tasmania has one of the highest rates of obesity in Australia. In 2017–2018, the Australian Bureau of Statistics reported more than two-thirds (70.9%) of Tasmanian adults were overweight or obese. Alarmingly, data also suggest that the proportion of Tasmanian children with overweight or obesity is approximately 30%.1 Due to the potential for a range of obesity-related health consequences, urgent preventative action is required to reduce population rates of overweight and obesity in Tasmania. Intervention is required from early in life as infancy is an acknowledged critical period. Accurate assessment of infant growth and development, including body composition, is of particular importance in this context.
Despite susceptibility to measurement inaccuracy, anthropometric measures such as weight, length, head circumference and skinfolds are routinely used for paediatric assessment. For instance, birth weight and weight-for-length (WFL) percentile scores are widely used to assess infant growth and nutrition status globally.2 It is important to appreciate the relative merits of anthropometry, including anthropometric indices, and assessments of growth and development encompassing objective measurement of body composition. The increased availability of more accurate measures of body composition in newborns, including air displacement plethysmography (ADP) via PEA POD,3 enables greater assessment options in both clinical and research contexts.
Growth ‘reference’ charts, such as those generated by the Centers for Disease Control and Prevention 2000, have been widely used to define overall health and nutritional status of infants.4 However, these charts from the USA are limited to the population they were derived from.5 Growth charts that reflect ideal healthy growth of infants are more appropriate, in particular, the prescriptive standards published by the WHO and derived from the Multicentre Growth Reference Study.6 These charts provide a ‘standard’ for optimal growth in early life but also minimise the potential for erroneous diagnosis of undernutrition/overnutrition (ie, overweight and obesity). Since their release in the early 2000s, more than 100 countries, including Australia, have endorsed and used these standards. However, numerous countries have reported deviations in average height and weight in different national and ethnic groups compared with the WHO child growth standards.7 8 To the best of our knowledge, anthropometric profiles of Tasmanian newborns have not been evaluated against the WHO child growth standards. The aims of the current study were to
Evaluate the size of Tasmanian infants at birth and at 3 and 6 months postpartum in relation to WHO child growth standards.
Assess body composition changes in Tasmanian infants at the extremes of the size (ie, WFL) spectrum.
Methods
Study design and setting
The study cohort consisted of 315 infants (~90% Caucasian) recruited between 2017 and 2019 (as part of the Australian arm of a multicountry collaborative project), from the Launceston Region (Northern Tasmania, Australia) using a range of advertising approaches. All data were collected at the maternity ward of the Launceston General Hospital. Inclusion criteria included (1) mothers ≥18 years of age and able to speak and understand English, (2) gestational age at birth between 37+0 and 41+6 weeks and (3) having a singleton pregnancy. Women were excluded if (1) they presented with significant morbidities or (2) the infants were born with a congenital anomaly. An initial (birth) measurement was undertaken within the first 72 hours of life and infants returned for subsequent follow-up testing at 3 and 6 months.
Measurement of infants
Length (L) to the nearest millimetre was measured in duplicate using an infantometer (SECA Corp., Hamburg, Germany). PEA POD (COSMED, Rome, Italy), a validated ADP device, was used for the measurement of body weight (W), and prediction of fat mass (FM), fat-free mass (FFM), percentage fat mass (%FM), percentage fat-free mass (%FFM), body density and volume. Briefly, a system check was undertaken, and the device was calibrated using a standardised volume phantom according to the manufacturer’s guidelines, prior to each testing session. Subsequently, body weight was measured (using the integrated PEA POD scale) in unclothed infants and hair was flattened out (with a hair cap or baby oil) prior to placing them in the automatic volume measurement capsule for body composition measurement.
Statistical analysis
Preliminary analysis
WFL and Body Mass Index (BMI) were calculated as follows:
WFL=birth wt (kg)/length (m); BMI=birth weight/(length (m))2.
WFL centile values for male and female infants were determined using WHO postnatal reference standards.6 Subsequently, three growth categories (<3rd percentile, between 3rd and 97th percentiles and >97th percentile) were established based on the WFL centile values. Z-scores for W, L, WFL and BMI at birth 3 and 6 months were enumerated using the WHO Anthro Survey Analyser tool.
Analysis
All statistical analyses were conducted using the Statistical Package for the Social Sciences software V.27 and the R Project for Statistical Computing V.4.0.3.9 Descriptive characteristics are presented as means and SD. Sex differences in anthropometric parameters at birth were assessed using independent samples t-tests. At the same time point, a 2×3 factorial analysis of variance (ANOVA) was used to compare the body composition of male and female infants who were in the different ranges of the WFL spectrum. Longitudinal change in body composition (ie, %FM accrual trajectory) was estimated in all infants using quantile regression.10
Patient and public involvement statement
Patients or the public were not involved in the design of this research. This data were gleaned from a larger Australian arm of a multicountry collaborative project.
Results
One hundred and fifty-one male and 164 female infants were included in the analysis at birth (table 1). Average gestational age was 39.5 weeks (range 37–42 weeks) for both sexes. Male infants were larger compared with female infants as indicated by the significantly higher birth weight, length and head circumference (p<0.05 for all, table 1). In terms of body composition, male infants had higher FFM (3.0 vs 2.9 kg) and lower FM (0.3 vs 0.4 kg) compared with female infants (table 1). Neither WFL nor BMI was different between sexes.
Descriptive characteristics (means±SD) of male and female infants at birth
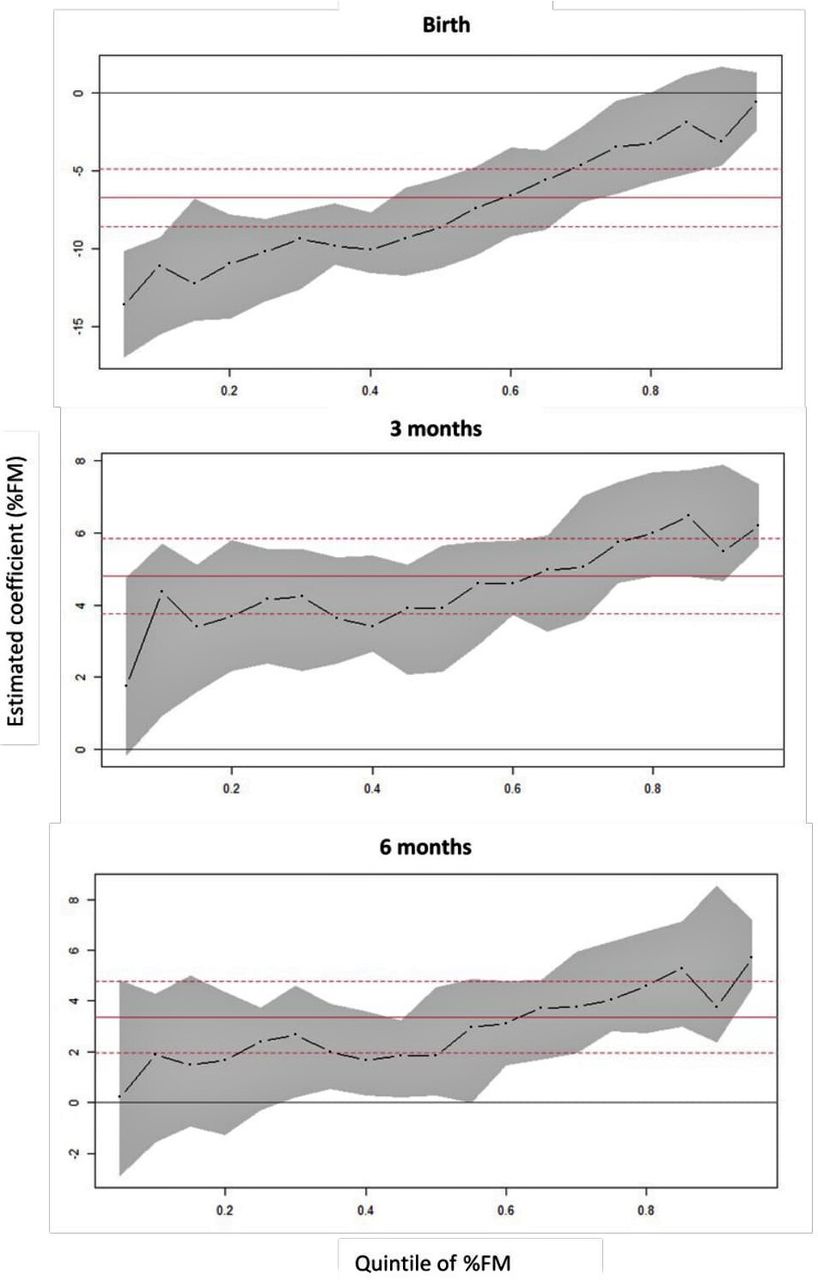
It is noteworthy that a higher proportion of male infants were in the extremes (ie, <3rd and >97th percentile) of the growth spectrum. A 2×3 factorial ANOVA revealed no statistical differences (p=0.292 for sex×growth category) for %FM or %FFM between male and female infants in the different ranges of the WFL spectrum at birth (table 2). However, significant within-group differences (p<0.001 for growth category) were evident for both parameters at this time point. In both sexes, infants above the 97th percentile had the highest body fat levels and lowest lean muscle mass. Longitudinal evaluation of all infants revealed divergent body composition trajectories (figure 1A–C and online supplemental figure 1) over the first 6 months. Quantile regression analysis for %FM (figure 1A–C) revealed that compared with birth, the conditional median for %FM adjusted for WFL increased by 3.9% (95% CI 2.2% to 5.6%) at 3 months and by 1.9% (95% CI 0.3% to 4.5%) at 6 months—indicating a possible convergence of %FM levels by 6 months of age.
Supplemental material

Relative fat mass accrual. Solid red line indicates ordinary least squares regression coefficient, and its CI is indicated by the broken red lines. The broken black lines indicate quantile regression coefficients with the CIs indicated in grey shaded areas. %FM, percentage fat mass.
Comparison of body composition between male and female infants across the weight-for-length spectrum at birth
Overall, there were normal distributions of z-scores for all measured parameters in both male and female infants across the first 6 months of life (figure 2). The mean z-score for length was lower in this Tasmanian cohort (both male and female infants) compared with the WHO child growth standards at all three time points (table 3). Interestingly, the mean z-score for weight in all infants was similar to the WHO child growth standards at birth, with a left shift at 3 months (−0.23 for male infants and −0.16 for female infants) before returning to the standards at 6 months (table 3). Z-scores for BMI and WFL continued to shift right from birth to 6 months (table 3). For the most part, the symmetry of growth curves of the current cohort matched (as indicated by the z-scores/skewness for length, age, weight-for-age, WFL and BMI) that of the WHO child growth standards at all three time points (table 3 and figure 2). The largest asymmetries were observed for weight and BMI in male infants at 3 months of age (table 3).

Sex-specific growth patterns in Tasmanian infants at birth and 3–6 months in relation to WHO prescriptive standards.
Comparison (standard scores) of Tasmanian infants against the international growth standards defined by the WHO
Discussion
Infant growth is inherently labile which makes the determination of optimal growth particularly challenging. This research evaluated anthropometric and body composition profiles of Tasmanian newborns against the WHO child growth standards. Overall, growth of Tasmanian infants in the first 6 months of life was similar to the global prescriptive standards. The minor variations in averages observed (figure 2 and table 3) may be the result of naturally occurring undulations during growth, namely, periodic spurts of saltatory growth interspersed among static periods.11
Existing research indicates that the assessment of newborn body composition is a better predictor of infant nutritional status and quality of growth than anthropometry alone.12 In the current study, it was interesting that body composition trajectories of infants from the extremes of the size spectrum (ie, lower and higher percentiles) appear to converge at the 6-month time point. More importantly, this suggests that infants at the lower end of the size spectrum are showing the most precipitous accrual in %FM, and the steepest decline in %FFM. This rapid gain in FM is similar to the classic pattern of ‘catch-up’ growth reported in premature and small-for-gestational age babies.13 Nevertheless, it is not possible to be conclusive regarding the effects of FM catch-up without an in-depth analysis of FM accrual velocity.14 Currently, prescriptive standards for FM and FFM accretion velocity do not exist. It is also noteworthy that the current regression approach to investigate body composition trajectories, though uncommon, is superior to the conventional, clinically relevant approach of approximation by categorising the otherwise continuous variables and investigating variables using binary or multinomial logistic regression.
Regardless, differences in body composition trajectories in early life should be of substantial interest in the determination of adequacy of growth in infants. Although the exact mechanisms are yet to be elucidated, it is possible that significant metabolic changes associated with different body composition accrual patterns may potentially manifest as metabolic diseases in childhood or in adulthood.15 Changes in body composition in early life are affected by a range of factors, including postpartum nutritional conditions, maternal characteristics including body weight, prepregnancy BMI and the intrauterine environment.16 17 More specifically, existing evidence suggests that infant FM is particularly reflective of the intrauterine environment and energy supply in the last trimester, whereas FFM is largely determined via heredity.18 Numerous studies have reported higher FM in infants fed breast milk in the first 6 months of life.19 20 The fact that a significant proportion (ie,~60% in Baby–Bod vs 40% state-wide average) of infants in our cohort were breast fed up to 6 months of age may have contributed to the patterns of FM accretion observed.
It is well established that the first 1000 days of life (from conception to 2 years of age) are crucial in providing infants with a sound base for a healthy future. Accordingly, it is imperative that the growth of infants is monitored and evaluated against the global standards for optimal growth and development during this period. Across the 6 months, we observed a right shift of z-scores for WFL/BMI in both male and female infants, indicating a propensity for WFL/BMI to be above average in comparison to the WHO child growth standards. This may be an early indication of the weight and size trajectory that will ensue in these infants into early childhood and perhaps adulthood. Frequent growth monitoring beyond the first 6 months of life is required to assist in the determination of the long-term effects of these early observations.
Although the current findings indicate that most infants demonstrated optimal growth, a degree of circumspection is required regarding the interpretation of results. First, our cohort was a healthy convenience sample from one region and was not representative of all Tasmanian infants. Recent Australian evidence indicates that prevalence rates of overweight and obesity can vary greatly among young children from culturally and linguistically diverse backgrounds.21 The modest overall sample size, including very small numbers at the extremes of growth (ie, <3rd and >97th percentiles), plus the lack of racial and ethnic diversity in our cohort, limits the potential to extrapolate findings to the wider Tasmanian population.
Environmental factors have significant implications for a child’s nutritional status.22 WHO child growth standards are prescriptive and provide a basis for how healthy infants born to healthy mothers under optimal conditions should grow. The standards are strictly based on full-term, healthy, singleton and morbidity-free infants who were predominantly breast fed for at least the first 4 months of life. As such, the standards provide a methodologically robust tool for growth monitoring in early life. Nevertheless, several countries have been slow to adopt these standards,23 24 and some Australian clinicians have advocated against the use of the WHO standards in early life as they potentially negatively influence the breastfeeding rate by overestimating the prevalence of undernutrition.25
Overall, our research indicates that the growth of this select cohort of Tasmania infants is consistent with the WHO child growth standards. The study also highlights how the inclusion of body composition assessment can help identify distinct growth patterns among infants with underweight or overweight. To increase the generalisability of the current findings, it would be prudent to repeat this analysis with a broader study population representative of the wider Tasmanian infant population. Given the inevitability of secular changes in growth patterns, it will also be important to recalculate and update these comparisons periodically. Further, it would be meritorious to follow-up these infants into adolescence and early adulthood to determine the various manifestations of early life body composition patterns.
Data availability statement
All data relevant to the study are included in the article or uploaded as supplementary information.
Ethics statements
Ethics approval
All study procedures were approved by the Human Research Ethics Committee (Tasmania) Network. Written informed consent was obtained from parents prior to enrolment in the study.
Acknowledgments
We thank Dr Steve Street and Anne Hanley for comanaging the project, all research staff for assistance in the collection of data, Launceston General Hospital midwifery team for assisting with recruitment of participants and the Clifford Craig Foundation for providing consulting rooms for research data collection.
References
Supplementary materials
Supplementary Data
This web only file has been produced by the BMJ Publishing Group from an electronic file supplied by the author(s) and has not been edited for content.
Footnotes
Contributors APH, NMB and KDKA: conceptualisation/design of the study, review and editing of the manuscript. SJ and APH: formulating research questions, writing and editing drafts, data collection/analysis. JMB: review and editing of manuscript drafts. MPH: data collection, review and editing of manuscript drafts.
Funding This work was supported, in part, by the International Atomic Energy Agency (CRP E43028 contract number 20880), the Bill & Melinda Gates Foundation (OPP1143641) and St.LukesHealth.
Competing interests None declared.
Provenance and peer review Not commissioned; externally peer reviewed.
Supplemental material This content has been supplied by the author(s). It has not been vetted by BMJ Publishing Group Limited (BMJ) and may not have been peer-reviewed. Any opinions or recommendations discussed are solely those of the author(s) and are not endorsed by BMJ. BMJ disclaims all liability and responsibility arising from any reliance placed on the content. Where the content includes any translated material, BMJ does not warrant the accuracy and reliability of the translations (including but not limited to local regulations, clinical guidelines, terminology, drug names and drug dosages), and is not responsible for any error and/or omissions arising from translation and adaptation or otherwise.