Article Text

Abstract
Objective The Latin American Network of Congenital Malformations: ReLAMC was established in 2017 to provide accurate congenital anomaly surveillance. This study used data from ReLAMC registries to quantify the prevalence of microcephaly from 2010 to 2017 (before, during and after the Zika virus epidemic).
Design Nine ReLAMC congenital anomaly registries provided case-level data or aggregate data for any live births, still births or terminations of pregnancy with microcephaly. Births to pregnant women infected with Zika virus first occurred in Brazil in 2015, and in the remaining registry areas in 2016 with the exception of Chile that did not experience Zika virus. Therefore the prevalence of microcephaly for 2010–2014 and individual years 2015, 2016 and 2017 was estimated using multilevel random effect Poisson models. Clinical classification and characteristics of the cases were compared pre and post Zika for all centres providing individual case-level data.
Results The prevalence of microcephaly for all registries excluding Brazil was 2.3 per 10 000 (95% CI 2.0 to 2.6) for 2010–2014 rising to 5.4 (95% CI 4.8 to 6.0) in 2016 and 5.9 (95% CI 5.3 to 6.6) in 2017. Brazil had a prevalence of 0.6 per 10 000 (95% CI 0.5 to 0.6) in 2010–2014, rising to 5.8 (95% CI 5.6 to 6.1) in 2015, 8.0 (95% CI 7.6 to 8.3) in 2016 and then falling in 2017. Only 29 out of 687 cases of microcephaly were reported as congenital Zika syndrome in countries excluding Brazil.
Conclusions The prevalence of microcephaly was influenced both by Zika causing congenital Zika syndrome and by increased reporting awareness.
- epidemiology
- data collection
Data availability statement
Data may be obtained from a third party and are not publicly available. The authors of this paper cannot release the de-identified participant data analysed in this paper, as the data belong to each registry. Access to the data may be obtained by applying individually to each congenital anomaly registry or to the ReLAMC (Rede Latino Americana de Malformaciones Congénitas) network with a research proposal (relamcoord@gmail.com).
This is an open access article distributed in accordance with the Creative Commons Attribution Non Commercial (CC BY-NC 4.0) license, which permits others to distribute, remix, adapt, build upon this work non-commercially, and license their derivative works on different terms, provided the original work is properly cited, appropriate credit is given, any changes made indicated, and the use is non-commercial. See: http://creativecommons.org/licenses/by-nc/4.0/.
Statistics from Altmetric.com
What is known about the subject?
Many maternal infections (including Zika virus) increase the risk of specific congenital anomalies occurring. The prevalence of microcephaly was reported to increase in several areas with high levels of Zika virus infections.
What this study adds?
The prevalence of microcephaly did increase in areas with Zika virus infections. However, some of these increases were due to the improved diagnosis or increased reporting of microcephaly that occurred. Reporting of Zika virus and other maternal infections associated with the microcephaly was deficient.
Introduction
In late 2015, there were reports of a dramatic increase in the prevalence of microcephaly in babies born in Brazil coinciding with an outbreak of the Zika virus several months earlier.1 There is now sufficient evidence to confirm that Zika virus infection during the first trimester of pregnancy increases the risk of microcephaly in the baby.2 The microcephaly epidemic across Latin America highlighted the necessity of accurate congenital anomaly surveillance. The Latin American Centre for Perinatology, Women and Reproductive Health of the Pan American Health Organization (PAHO/WHO) seeks to strengthen surveillance systems in the countries of the region.3 ReLAMC—the Latin American Network of Congenital Anomaly Surveillance was established in November 2017 (https://globalbirthdefects.tghn.org/news/new-surveillance-network-latin-americarelamcbuilding-strength/). The objectives of ReLAMC are to provide essential epidemiologic information on congenital anomalies in Latin America and to improve detection of new epidemics of congenital anomalies.
This study aimed to use data from registries collaborating with ReLAMC to provide contemporary estimates of the prevalence of microcephaly across Latin America from 2010 to 2017 to demonstrate the value and strength of ReLAMC. The prevalence of microcephaly was chosen, due to its association with the Zika virus epidemic and the associated interest in changes in its prevalence over the time of the epidemic observed in other studies4–12 and the lack of accurate information due to underreporting in the PAHO/WHO Zika virus surveillance system.13 In addition to the Zika virus, the STORCH infections ((s)yphilis, (t)oxoplasmosis, (o)ther agents, (r)ubella, (c)ytomegalovirus and (h)erpes simplex infection) are associated with microcephaly in the fetuses and therefore information about STORCH infections is also important to report.
Methods
Fifteen national and regional congenital anomaly registries in Latin America who are members of ReLAMC, or who are interested in participating in ReLAMC, were invited to take part in the study. Each registry completed a questionnaire concerning information on data availability on the coding and definition of microcephaly, congenital Zika virus syndrome (CZS) and other maternal infections (STORCH) associated with microcephaly. Only eight registries were able to contribute individual case data to this study. All information shared was previously anonymised. Each registry was required to obtain the necessary permissions to share the data with St George’s, University of London and several registries did not have the resources to obtain the necessary permission or to provide the data requested. Registries that were able to, provided anonymised case-level data for any live births, still births or terminations of pregnancy with a mention of microcephaly. Data on gender, birth weight, gestational age, head circumference and other additional anomalies were provided. If the registries were not able to provide individual case data, aggregate data were sent. Data on all birth outcomes from 1 January 2010 to 31 December 2017 were sent including the total numbers of births for the area covered by the registry. For registries which sent individual case data, cases were classified clinically by a paediatrician using international classification of diseases 10th revision (ICD-10) codes only. Orioli et al 14 did not include microcephaly associated with typical anencephaly or spina bifida. In this study, it is included.
Patient and public involvement
The public were not involved in the design, or conduct, or reporting, or dissemination plans of our research.
Statistical methods
Births to pregnant women infected with Zika virus first occurred in Brazil in 2015,9 10 15 and in the remaining registry areas in 20166 7 11 12 with the exception of Chile that did not experience Zika virus.11 The year of birth was therefore categorised into 2010–2014 (pre Zika for all registries), 2015 (Zika in Brazil only), 2016 (Zika in Brazil and all registries excluding Chile) and 2017. The prevalence of microcephaly was estimated using multilevel random effect Poisson models (Stata gllamm) nested within registry, with the number of cases as the dependent variable and the number of pregnancies as the exposure variable. Year of birth was considered as a random effect with indicator variables identifying the individual years 2015, 2016 and 2017. Models were fitted for all registries excluding Brazil. Brazil was considered separately due to the much larger numbers of births and the earlier timing of the Zika virus epidemic. Prevalence rate ratios (PRRs) for each of 2015–2017 relative to 2010–2014 were estimated. Multilevel models were used as they assume that the true prevalence will vary over time in each registry and also vary between registries. Poisson models were used as these models predict rare events (microcephaly case) in a population with many events (all births). Exact Poisson 95% CIs are provided. Clinical classification and characteristics of the cases for 2010–2015 versus 2016–2017 (Brazil 2010–2014 vs 2015–2017) were compared using χ2 and Fisher’s exact tests. All analyses were carried out in Stata V.16.
Results
Information from questionnaires
Questionnaire responses were provided from 12 registries: Argentina (National), Brazil (National), Chile (National), Chile (Maule), Colombia (Bogota), Colombia (Cali), Costa Rica (National), Mexico (Nuevo León), Nicaragua (León), Panama, Paraguay and Uruguay. Eight registries also provided individual anonymised case data and annual births populations for the area covered by their registry: Argentina (2010–2016), Brazil (National), Chile (National), Chile (Maule), Colombia (Bogota), Colombia (Cali), Costa Rica (National) and Mexico (Nuevo León). Nicaragua (León) provided prevalence rates only and Argentina provided aggregate data for 2017. Table 1 provides information on the nine registries providing data on microcephaly. There were three population-based registries and the size of their birth populations varied considerably, from 10 000 to 3 million, reflecting whether they were regional or national registries.
Latin American Network of Congenital Malformation registries contributing data to the study
Microcephaly
Table 1 shows how the registration of microcephaly cases varies according to the registry. All registries rely on clinicians diagnosing microcephaly—none of them rely solely on the head circumference measurement. However, there were variations in the national guidelines, with all guidelines defining microcephaly occurring when the head circumference is less than 2SD below the mean for age and sex, apart from Brazil whose guidelines changed from less than 3SD to less than 2SD in 2016. Seven registries routinely recorded head circumference when a diagnosis of microcephaly was reported, with Costa Rica starting to record head circumference in 2016.
Congenital Zika virus syndrome
The two registries in Colombia had a special reporting system for CZS while the other registries had introduced CZS codes into their databases. Costa Rica also has a special surveillance subsystem for CZS, but data were not available at the time of this study.
Microcephaly associated with maternal infections other than Zika
There is screening for syphilis and HIV in 11 registries, for toxoplasmosis in 7, rubella in 5 and for Cytomegalovirus (CMV) in 2. However, only five registries (Argentina, Brazil, Colombia Bogota, Colombia Cali and Nicaragua) reported that maternal infections were coded if the information was available, but stated that this information was often incomplete. Three countries (Brazil, Chile and Costa Rica) have separate surveillance systems for maternal infections, but these are not directly linked through to the congenital anomaly registry.
Analysis of microcephaly case data
In tables 2–4, data for Brazil are presented separately due to the larger numbers of births and the earlier timing of the Zika virus epidemic, with the subsequent increases in microcephaly due to CZS expected to start in 2015 in Brazil and 2016/2017 in the other countries.
Number of microcephaly cases, the number identified as having congenital Zika virus syndrome, the prevalence per 10 000 births and prevalence rate ratios (PRRs) for microcephaly cases in 2015, 2016 and 2017 compared with 2010–2014
Clinical classification of microcephaly cases: comparing earlier years (pre-Zika) with later years (during and after Zika)
Characteristics of microcephaly cases
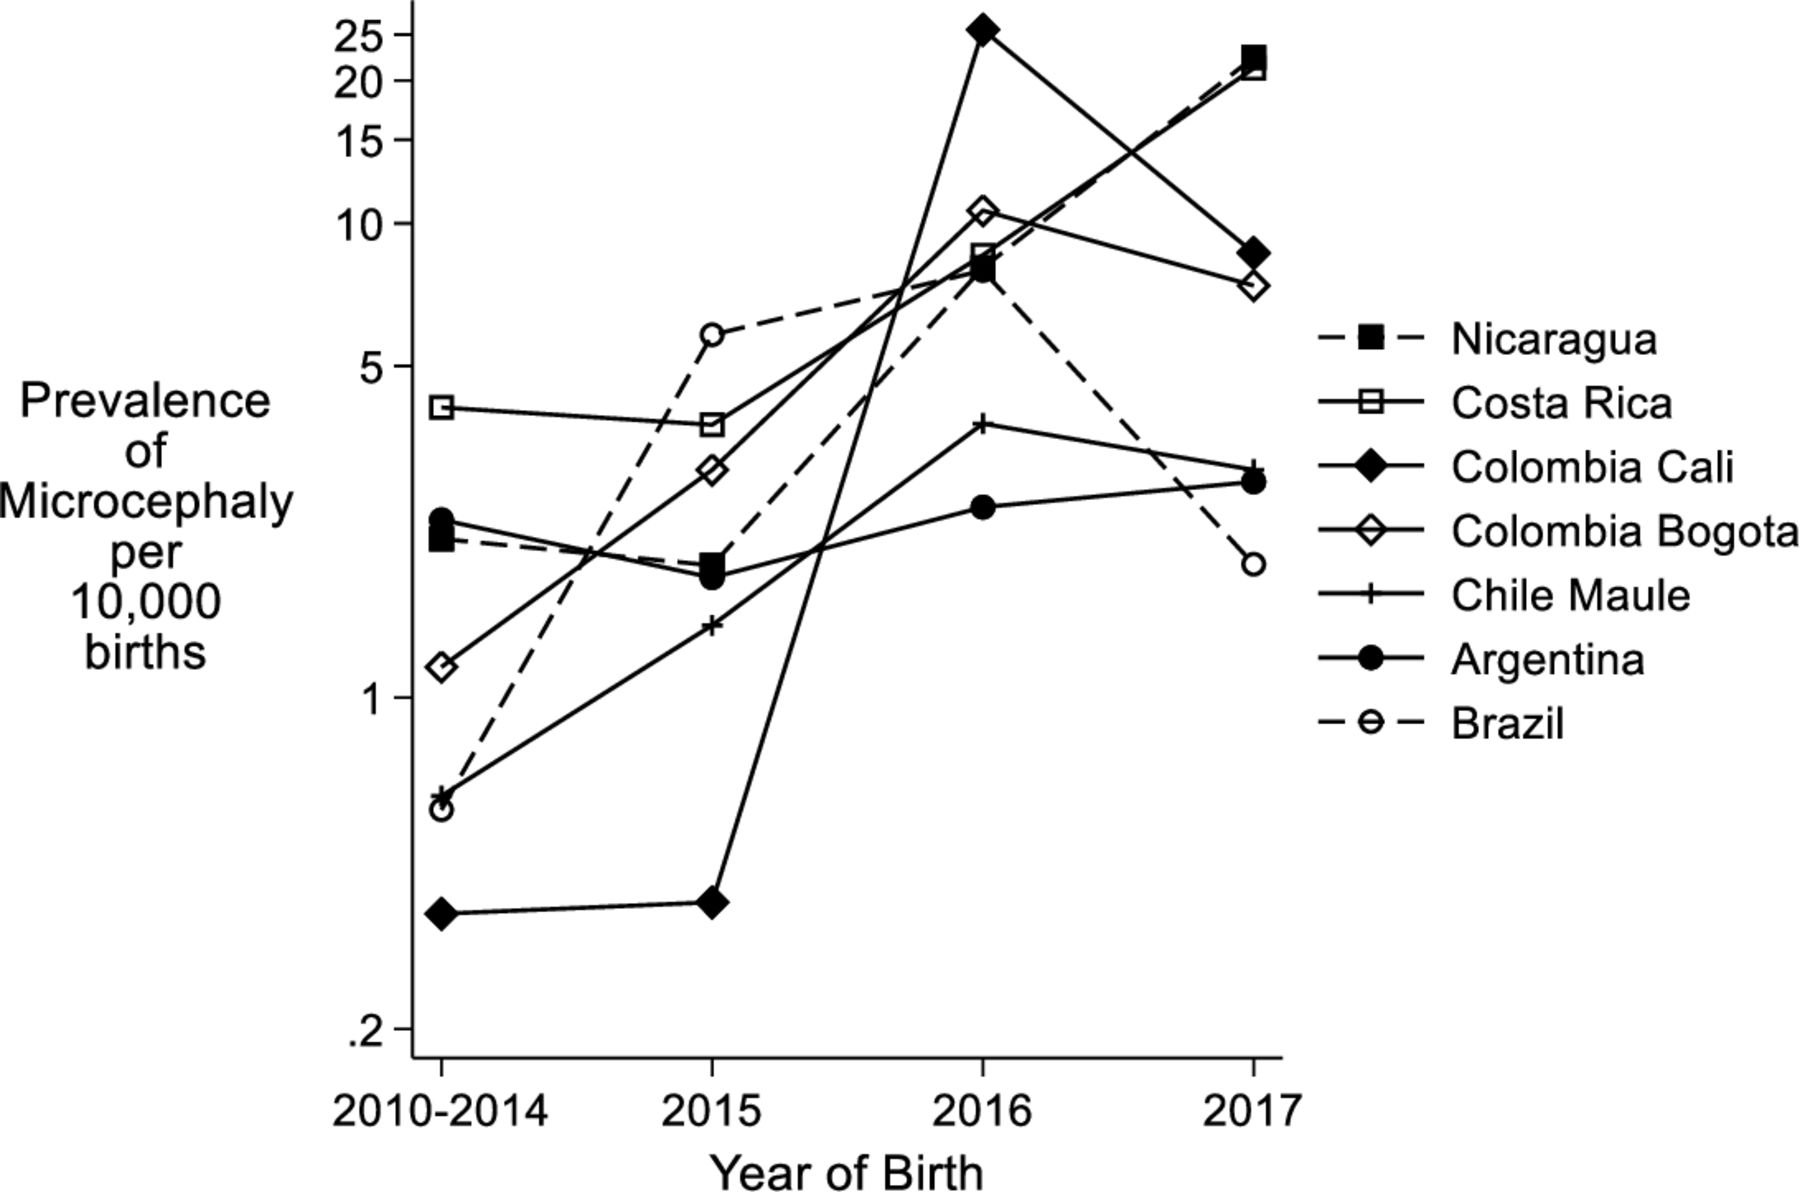
Figure 1 shows the prevalence of microcephaly cases for 2010–2014 for each registry and table 2 in addition compares the prevalence for each individual year from 2015 to 2017 with that in 2010–2014. The overall prevalence of microcephaly for all centres excluding Brazil for 2010–2014 was 2.3 per 10 000 (95% CI 2.0 to 2.6) rising to 5.4 (95% CI 4.8 to 6.0) in 2016 and 5.9 (95% CI 5.3 to 6.6) in 2017. In contrast, Brazil had a prevalence of 0.6 per 10 000 (95% CI 0.5 to 0.6) in 2010–2014, rising to 5.8 (95% CI 5.6 to 6.1) in 2015, 8.0 (95% CI 7.6 to 8.3) in 2016 and then falling in 2017, 1.9 (95% CI 1.8 to 2.1). There was variation between centres both in the prevalence rates and when the increases occurred. Chile (Maule) and the two Colombian centres had their highest rates in 2016, whereas other centres had their highest rates in 2017. Brazil experienced a 10-fold increase in prevalence in 2015 compared with 2010–2014, continuing to rise in 2016. As well as Brazil, Colombia (Bogota) had a significant increase in 2015 compared with 2010–2014. All centres experienced significant increases between 2016 and 2017 relative to their 2010–2014 levels except for Argentina which showed little change.
Prevalence of microcephaly per 10 000 births from 2010 to 2017 according to registry.
Table 2 shows the 29 microcephaly cases that were identified as CZS cases in the registries compared with the much greater increases in microcephaly. The registries used different coding systems. In Argentina, one case was coded U06.9 ‘Zika virus disease, unspecified’, one coded ‘A92.8’, ‘Other specified mosquito-borne viral fevers’ and there was a mention of Zika in a text field for the three other cases. In Costa Rica, the 20 cases had P35.8 or P35.82 ‘Other congenital viral diseases’ coded with Zika virus mentioned in the text descriptions and ‘A92.8: Zika’ also specified under maternal illness in six of their cases. In Mexico, the registry coded A92.9 ‘Mosquito-borne viral fever, unspecified’ under maternal illness during pregnancy with additional text confirming Zika virus and the Colombia, Cali registry had mention of confirmed Zika in the text field for maternal infections for one case. No information on whether the CZS cases had laboratory confirmation was recorded in any registry.
Table 3 compares the clinical classification of microcephaly cases in the years before the Zika virus epidemic (2010–2015) with the years during and after the epidemic (2016–2017) for all countries except Brazil. For Brazil the Zika virus epidemic occurred earlier in 2015 and therefore the years 2010–2014 are compared with 2015–2017. As expected the prevalence of isolated microcephaly increased with the occurrence of Zika with a greater proportion of all microcephaly cases being isolated. For all centres excluding Brazil, the prevalence of microcephaly with associated malformations of neural origin and with genetic syndromes (excluding chromosomal) did not significantly change, and polymalformed without syndrome diagnosis increased although the relative proportion decreased (due to the increase in isolated microcephaly). In Brazil, the prevalence of microcephaly increased in all classifications, although the relative proportions decreased (due to the increase in isolated microcephaly). The number of microcephaly cases associated with maternal infections did increase in the later years, but was still extremely low.
Table 4 compares the characteristics of the microcephaly cases in the years before the Zika virus epidemic (2010–2015) with the years during and after the epidemic (2016–2017) for all countries except Brazil. As in table 3, the data from Brazil are presented separately for 2010–2014 compared with 2015–2017 to reflect the occurrence of the Zika virus epidemic in 2015 in Brazil compared to 2016/2017 in the other countries. For all centres cases excluding Brazil, the proportion of extremely low birthweights (<3 SD) remained similar; for Brazil, this proportion decreased after 2014. All centres reported statistically significantly smaller head circumferences (Brazil did not provide this data). However, they were less likely to be a pre-term or twin birth in the later years. It is also important to note that there were far more missing head circumferences in the earlier period in the table (2010–2015).
Discussion
This is the second paper reporting results from the newly formed ReLAMC network.16 It provides additional data in the impact of Zika virus on the prevalence of microcephaly in seven countries in Latin America. For most registries, there are clear increases in the prevalence of microcephaly in 2016 and 2017 compared with those born in 2010–2015 which are consistent with the reported dates for the Zika virus epidemics and first trimester teratogenicity.5–7 12 The Zika virus epidemic occurred earlier inBrazil4 8–10 and therefore the increase in microcephaly started in 2015. Those born in later years were also more likely to be isolated microcephaly cases.
A small number of the cases born from 2010 to 2014 from Argentina, Chile and Colombia are included in the study by Orioli et all.14 This examined the prevalence of microcephaly in South America using data from ECLAMC (Latin American Collaborative Study of Congenital Malformations) which is derived from 107 hospitals in 10 South American countries from 2005 to 2014. The distribution of the clinical classification of the cases differed between the two studies, with the ReLAMC study having higher proportions ‘Isolated microcephaly cases’. This might be explained by this study classifying the cases according to ICD-10 codes, whereas the ECLAMC study had access to the written clinical descriptions, image results and other clinical information.
Data from the PAHO/WHO publications of cumulative cases of CZS available on the website (https://www.paho.org/hq/dmdocuments) up until January 2018 indicate that, in the registries in this study, the highest prevalences of CZS occurred in Brazil and Colombia and slightly lower ones in Costa Rica, which would be confirmed by the large increases in prevalence observed in Brazil, Bogota and Cali and the increases in Costa Rica.7 However, Argentina reported five cases to PAHO/WHO, which were identified in the data and they do not account for the increases in microcephaly observed in Argentina from 2015 to 2017, indicating these increases are likely due to be to improved diagnosis or more reporting of microcephaly. It is possible that other countries also observed an increase in prevalence of microcephaly which was partly due to Zika, and partly due to increased reporting. No CZS cases were reported in Chile which is expected as there are no aedes mosquitos that carry Zika virus in Chile and therefore the increases in the prevalence of microcephaly are likely to be due to increased reporting. The prevalence of microcephaly was extremely low in Brazil in 2010–2014, which is likely to be due to under-reporting in these years, with the change of definition of severe microcephaly exaggerating the differences in prevalence in the later years.
There were only 29 cases of Zika virus with microcephaly recorded in countries excluding Brazil, despite dramatic increases in the prevalence of microcephaly during this time. The increase in prevalence of microcephaly (particularly isolated) is likely to be due to both cases of CZS not being recorded and to a higher proportion of microcephaly cases being reported due to the impact of the Zika virus epidemic and the associated increased risk of microcephaly raising awareness about reporting microcephaly. All the registries, apart from Brazil, stated that the diagnostic criteria for microcephaly did not change during this time period. However, the Centers for Disease Control and Prevention (CDC) did develop a new case definition in 2016 for surveillance of birth defects potentially related to Zika virus infection, which was shown to identify a greater number of cases with microcephaly when applied retrospectively to birth defects occurring in 2013/2014.17
A very small proportion of cases were reported as embryopathies due to maternal infections other than Zika virus, indicating that although there is increasing awareness of microcephaly this awareness does not extend to the diagnosis and reporting of all maternal infections. The lack of accurate information on congenital infection syndromes shows the difficulties experienced in diagnosing and recording such cases in health systems and registries, as well as the lack of communication between maternal infection and congenital anomaly surveillance systems. Coding of congenital infections is mainly outside the Q chapter of the ICD coding system devoted to congenital anomalies, and there is not a clear division between maternal and fetal infection in the coding system. The burden of STORCH infections in Latin American countries is estimated to be considerable.18–21 As the prevalence of these maternal infections can be reduced by Public Health measures, this group of congenital anomalies is a preventable group for which it is valuable to have good estimates of baseline prevalence in order to encourage any actions that will reduce the prevalence, including screening (which is variable across countries) and the development of vaccines.
This paper shows that there is much work to be done in each of the countries to improve the reporting of congenital anomalies associated with maternal infections, including CZS, in order to evaluate preventive measures. It demonstrates the difficulties of interpreting microcephaly data, which was influenced both by Zika and by increasing reporting awareness. It also shows the power of data sharing in the Latin American region for congenital anomaly surveillance.
Data availability statement
Data may be obtained from a third party and are not publicly available. The authors of this paper cannot release the de-identified participant data analysed in this paper, as the data belong to each registry. Access to the data may be obtained by applying individually to each congenital anomaly registry or to the ReLAMC (Rede Latino Americana de Malformaciones Congénitas) network with a research proposal (relamcoord@gmail.com).
Ethics statements
Patient consent for publication
Ethics approval
Detailed information on the ethical approvals for the ReLAMC registries can be found in the ReLAMC Terms of Agreement and Commitments on request from relamcoord@gmail.com.
Acknowledgments
We wish to acknowledge Iván Landires (Panama), Marta Ascurra (Paraguay) and Mariela Larrandaburu (Uruguay) for contributing information about their registries.
References
Footnotes
Contributors JM, HD and IMO conceptualised and designed the study, drafted the initial manuscript, and reviewed and revised the manuscript. EL carried out the initial analyses, and reviewed and revised the manuscript. MdlPB-A, AB-L, MACT, BG, JH, PMH-V, MIR, CM, RP, DMPB, CR and IZ were responsible for the data collection in the congenital anomaly registries, provided the data and reviewed and revised the manuscript. All authors approved the final manuscript as submitted and agree to be accountable for all aspects of the work. JM is responsible for the overall content as the guarantor.
Funding This project ZikaPLAN is funded by the European Union’s Horizon 2020 research and innovation programme under Grant Agreement No. 734584.
Competing interests None declared.
Patient and public involvement Patients and/or the public were not involved in the design, or conduct, or reporting, or dissemination plans of this research.
Provenance and peer review Not commissioned; externally peer reviewed.