Article Text

Abstract
Objective To estimate traumatic brain injuries (TBIs) and acute care costs due to sports activities.
Methods A planned secondary analysis of 7799 children from 5 years old to <18 years old with head injuries enrolled in a prospective multicentre study between 2011 and 2014. Sports-related TBIs were identified by the epidemiology codes for activity, place and injury mechanism. The sports cohort was stratified into two age groups (younger: 5–11 and older: 12–17 years). Acute care costs from the publicly funded Australian health system perspective are presented in 2018 pound sterling (£).
Results There were 2903 children (37%) with sports-related TBIs. Mean age was 12.0 years (95% CI 11.9 to 12.1 years); 78% were male. Bicycle riding was associated with the most TBIs (14%), with mean per-patient costs of £802 (95% CI £644 to £960) and 17% of acute costs. The highest acute costs (21%) were from motorcycle-related TBIs (3.8% of injuries), with mean per-patient costs of £3795 (95% CI £1850 to £5739). For younger boys and girls, bicycle riding was associated with the highest TBIs and total costs; however, the mean per-patient costs were highest for motorcycle and horse riding, respectively. For older boys, rugby was associated with the most TBIs. However, motorcycle riding had the highest total and mean per-patient acute costs. For older girls, horse riding was associated with the most TBIs and highest total acute costs, and motorcycle riding was associated with the highest mean per-patient costs.
Conclusion Injury prevention strategies should focus on age-related and sex-related sports activities to reduce the burden of TBIs in children.
Trial registration number ACTRN12614000463673.
- health economics
- health services research
Data availability statement
All data relevant to the study are included in the article or uploaded as supplementary information.
This is an open access article distributed in accordance with the Creative Commons Attribution Non Commercial (CC BY-NC 4.0) license, which permits others to distribute, remix, adapt, build upon this work non-commercially, and license their derivative works on different terms, provided the original work is properly cited, appropriate credit is given, any changes made indicated, and the use is non-commercial. See: http://creativecommons.org/licenses/by-nc/4.0/.
Statistics from Altmetric.com
WHAT IS ALREADY KNOWN ON THIS TOPIC
Sports activities are frequently associated with traumatic brain injuries (TBIs) in children.
WHAT THIS STUDY ADDS
Bicycle riding had the most sports-related TBIs, and motorcycle-related TBIs were associated with the highest mean per-patient and total acute care costs.
Mild TBIs from bicycle riding and severe TBIs from motorcycle riding were associated with the highest total acute care costs for the sports cohort.
The highest mean per-patient costs were from horse riding in younger girls and motorcycle riding for older girls and boys in both age groups.
HOW THIS STUDY MIGHT AFFECT RESEARCH, PRACTICE OR POLICY
Injury prevention strategies should focus on age-related and sex-related sports activities to reduce the burden of TBIs in children.
While contact sports are common mechanisms of injury, they are often not associated with severe TBIs or high acute care costs.
Introduction
Injuries from sports activities are a global health concern, with children 5–14 years requiring more medical care than other ages.1 The need for comprehensive surveillance and injury prevention initiatives has been recognised internationally.2–4 Sports activities are frequently associated with traumatic brain injuries (TBIs) in children.5–7 In Australia, head trauma occurred with 5.8%–44% of all sports-related injuries in children with emergency department (ED) presentations between 1989 and 1993.5 Additionally, an increasing trend in hospitalisations for all sports injuries was reported between 2004 and 2010.8 In 2012, the age-standardised incidence rate of hospitalisations for all sports-related injuries in children ≤16 years was 281 per 100 000 population with annual costs of Australian dollar (AU) $40 million.9 There are no population-based estimates of ED presentations for paediatric sports-related TBIs in Australia. Sports were the second most common mechanism of injury in a cohort of approximately 18 000 Australian children presenting to ED with head injuries.7
In the UK, the annual incidence of head injuries in 2013 was 400 per 100 000 for children younger than 15 years. Sports activities were the second most frequent injury mechanism after falls, with rugby, football and horse riding being the most prevalent.6 In the USA, the incidence of non-fatal sports-related TBIs in children in 2018 was 299 per 100 000.10 An increasing trend in ED visits for sports-related TBIs was reported between 2001 and 2012, followed by a subsequent decline of 27% by 2018.10 11 Contact sports accounted for approximately 45% of injuries, with American football and bicycle riding accounting for the most TBIs.4 While playground-related TBIs were the most common mechanism for children younger than 10 years, American football in boys and soccer in girls accounted for the most TBIs for older children.4
The aim of this study was to estimate the ED and acute hospital costs for children with TBIs due to sports activities in Australia, stratified by mechanisms of injury, TBI severity, sex and age of the child.
Methods
This was a secondary analysis of the prospective multicentre Australasian Paediatric Head Injury Study (APHIRST), in which 17 841 Australian children <18 years with head injuries of all severities were enrolled between April 2011 and November 2014. There were two mixed and six free-standing children’s hospital EDs, all members of the Paediatric Research in Emergency Departments International Collaborative (PREDICT) network. The detailed methodology of the APHIRST study has been previously published.12 For this analysis, we excluded 2296 children enrolled in New Zealand to be consistent with the costing methods (figure 1). The other exclusions have been discussed previously.7 12

Patient flowchart: the Australasian paediatric head injury study sports cohort. ED, emergency department; TBI, traumatic brain injury.
The costing analysis was conducted from a publicly funded health system perspective, applying direct and indirect costs from the Royal Children’s Hospital (RCH) to patient-level data in the Australian cohort (online supplemental appendix 1).7 13 The details of the costing methods and data inputs have been published.7 Acute care included ED presentations with either discharge or acute admissions until hospital discharge. The total acute care costs and mean per-patient cost with 95% CIs for sports-related TBIs were estimated by sex, child age groups and injury severity. All costs were inflated to 2018 Australian dollars using the Reserve Bank of Australia General Consumer Price Index rates from 13 September 2019 and presented as pound sterling with the average exchange rate of UK £0.60 from 30 June 2018.14 15
Supplemental material
Sports-related TBIs for children ages 5–<18 years (sports cohort) were identified using the activity code for sports (activity=S) noted on the case report form of the APHIRST study.16 The research assistants assigned the activity codes at each site based on information the clinician recorded at the ED visit, obtained from medical record review and during the follow-up call.16 Epidemiology codes for activity, place and injury mechanism of injury employed by the Victorian Injury Surveillance Unit in Australia were used across all study sites in APHIRST.8 17 18 These codes were mapped to the International Classification of Diseases, 10th Revision-Australian Modification sports activity codes (U50–U71) (online supplemental appendix 2).9 19 The combined football codes (U50.01–U50.05) included rugby, Australian rules football, touch football, soccer and football–not otherwise specified.9 19
We considered injuries sports-related if they occurred from organised or recreational sports. Falls from playground equipment or casual play were excluded. Helmet use was noted for TBIs from bicycle riding. The sports cohort was stratified into two age groups (younger: 5–11 years and older: 12–17 years) based on the reported differences in physical activity levels in Australian children.20 TBI was defined as any injury to the brain caused by an external force.21 TBI severity was defined as mild, moderate and severe. Mild TBI was defined as Glasgow Coma Scale (GCS) scores of 13–15 on ED presentation, no neurological deficits, with no evidence of TBI on cranial CT or MRI if performed.22 Moderate TBI included either GCS scores 9–13 or 13–15 with neurological deficits or evidence of TBI on CT or MRI. Severe TBI was defined as GCS scores of ≤8.22 Data analysis was performed with Stata V.15.
Results
Sports cohort: patient characteristics
Of the 7799 Australian children between 5 years and 18 years with head injuries enrolled in APHIRST, 2903 (37%) had TBIs from sports activities (figure 1 and table 1). The mean age for the sports cohort was 12 years (95% CI 11.9 to 12.1 years), and 78% were male. The acute care costs for sports-related TBIs were £1.9 million, with mean per-patient costs of £669 (95% CI £566 to £772). The acute admission rate was 34%, with mean per-patient costs of £1559 (95% CI £1265 to £1853), which accounted for 80% of acute care costs. Paediatric intensive care unit admissions for 43 children (1.5% of the sports cohort) accounted for 29% of acute care costs, with mean per-patient costs of £13 199 (95% CI £8217 to £18180). There were no deaths reported from sports activities.
Sports cohort: demographics and acute care costs*
Sports cohort: TBI severity
Most head injuries from sports activities resulted in mild TBIs (94%), which were associated with 62% of the sports-related acute care costs with mean per-patient costs of £443 (95% CI £389 to £497) (table 1). Moderate TBIs occurred with 5% of injuries, accounting for 17% of sports-related acute costs, with mean per-patient cost of £2269 (95% CI £1622 to £2916). Severe TBIs in 1% of the sports cohort accounted for 21% of acute care costs, with mean per-patient cost of £13 395 (95% CI £6400 to £20 392).
Sports cohort: mechanisms of injury
The top 10 individual sports in decreasing frequency (figure 2 and table 2) cumulatively accounted for 76% of sports-related TBIs and 87% of acute care costs. Bicycle riding was associated with the most TBIs (14%) and 17% of sports-related acute care costs, with mean per-patient cost of £802 (95% CI £644 to £960). Children with bicycle-related TBIs who were not wearing helmets (48%) with mean per-patient cost of £1047 (95% CI £626 to £1468) accounted for 63% of bicycle-related costs. Motorcycle riding was associated with the largest proportion of moderate (9.1%) and severe TBIs (8.2%) for any sport. Further, with 3.8% of TBIs, motorcycle riding was associated with the highest mean per-patient cost of £3795 (95% CI £1850 to £5739) and acute costs (21%) from individual sports.

Sports-related TBI severity and acute care costs by age groups. Top 10 sports activities in decreasing order of injury frequency. CT, cranial tomography; GCS, Glasgow Coma Scale; NOS, not otherwise specified; TBI, traumatic brain injury.
Sports-related TBIs and acute care costs*
Team ball sports were associated with the most sports-related TBIs (45%), which accounted for 25% of acute care costs (online supplemental appendix 3). Specifically, the combined football codes (U50.01–U50.05) were associated with 39% of sports-related TBIs and accounted for 21% of acute care costs. On the other hand, wheeled non-motored sports, with 26% of TBIs, were associated with the highest acute costs (35%), and wheeled motor sports, with 3.9% of TBIs, were associated with the highest mean per-patient cost.
Sports cohort: mechanisms of injury and TBI severity
By TBI severity, mild TBIs from bicycle riding (93% of bicycle riding injuries and 13% of the sports cohort) and severe TBIs from motorcycle riding (8% of motorcycle riding injuries and 0.31% of the sports cohort) accounted for the highest acute care costs (11%) for the sports cohort (figure 2). In contrast, the combined football sports were associated with primarily mild TBIs and the lowest acute costs.
Sports cohort: age groups
In figure 2, the top 10 mechanisms of injury in decreasing frequency are shown for the younger and older age groups, which accounted for 70% and 86% of sports-related TBIs, respectively, and 79% and 91% of associated acute care costs. Of the 1286 children (44%) in the younger age group, 73% were male. Similarly, 82% of the 1617 children in the older age group were male.
In the younger age group, bicycle riding was associated with the highest proportion of TBIs (17%) and age group-related costs (26%). Although rugby was the most frequent injury mechanism in the older age group (14%), with 8% of acute care costs, motorcycle-related TBIs (3.8%) were associated with the highest age group-related costs (26%). For the younger age group, mild TBIs from bicycle riding were associated with the highest group-related acute costs (18%). Severe TBIs from motorcycle riding were associated with the highest group-related acute costs (15%) for sports injuries in the older age group.
Sports cohort: sex
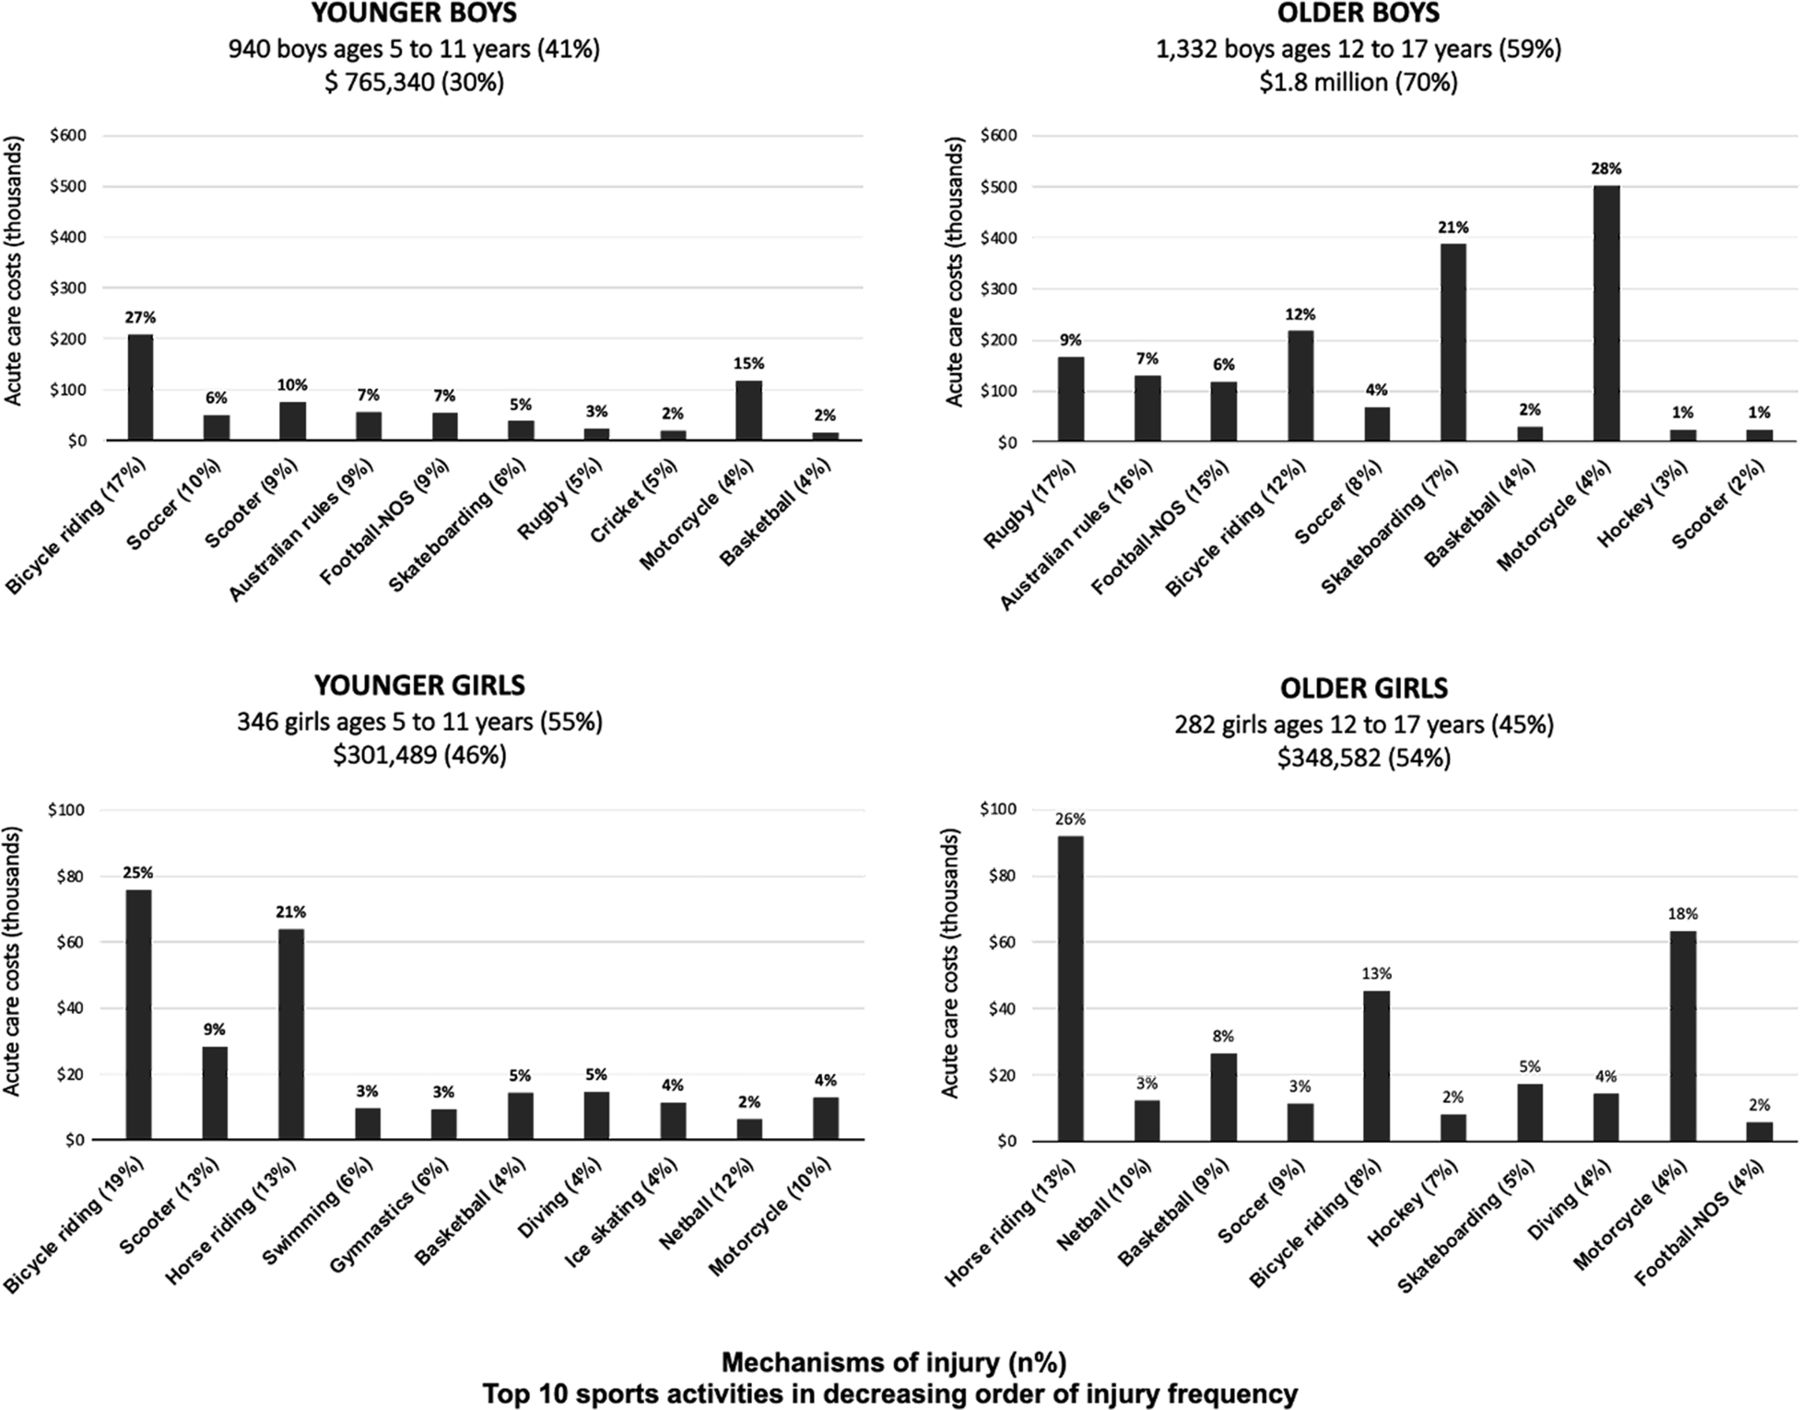
Boys accounted for 78% of the sports cohort and were associated with 80% of the acute care costs (table 1). For young boys, bicycle riding was associated with the most TBIs (17%) and the highest acute costs (27%) for the age group (figure 3 and online supplemental appendix 4). For boys in the older age group, rugby had the most TBIs (17%); however, motorcycle-related TBIs (3.8%) accounted for the highest acute costs (28%) for the age group. Motorcycle riding was associated with the highest mean per-patient costs for boys in both age groups (online supplemental appendix 4).
Acute care costs of sports-related TBIs stratified by age and sex. TBI, traumatic brain injury; NOS, not otherwise specified.
For young girls, bicycle riding was associated with the most TBIs (19%) and the highest acute costs (25%) for the age group (figure 3 and online supplemental appendix 5). For girls in the older age group, horse riding was associated with the most TBIs (13%) and the highest total acute costs (26%) for the age group. The highest mean per-patient costs were associated with horse riding and motorcycle riding for younger and older girls, respectively (online supplemental appendix 5).
Discussion
This cost of illness study estimates the frequency and economic burden of TBIs from sports activities in children between 5 years and 18 years presenting to eight tertiary EDs in Australia. While bicycle riding was associated with the most TBIs, motorcycle-related TBIs, with 4% of injuries, were associated with the highest total and mean per-patient acute care costs. When the combined effect of TBI severity and sports activities on the acute care costs were explored, bicycle riding injuries with mild TBIs and motorcycle riding with severe TBIs accounted for similar acute care costs for the sports cohort. Therefore, while motorcycle-related injuries had the most severe TBIs and the highest patient-level costs, the combined effect of injury frequency and TBI severity from bicycle and motorcycle riding contributed to the high economic burden on the health system.
In a recent population-based report, the total acute care costs for all sports-related injuries in Australia were AU$764 million for fiscal year 2019.23 ED visits for all sports injuries accounted for 22% of the total acute care costs (AU$164 million), and 37% of the ED costs were for children <20 years, who accounted for 25% of the Australian population.23 24 The acute care costs for sports-related TBIs were AU$32 million (4% of total costs for all sports injuries), and 95% were incurred at public hospitals. Similar to our results, acute admissions for sports-related TBIs accounted for 80% of the acute care costs.23
There are few published reports of paediatric sports-related head injuries in Australia.16 18 22 While one study excluded bicycle, motorcycle and playground injuries,22 another did not report motorcycle-related head injuries.16 Australian rules football was associated with the highest proportion of head injuries in the retrospective study,22 baseball and softball were associated with the most clinically important TBIs in the prospective study.16 In the current study, we excluded playground injuries. We reported bicycle riding in younger children, rugby in older boys and horse riding in older girls were associated with the most sports-related TBIs.
To our knowledge, no prior studies have compared the acute costs of TBIs from sports activities in children. In this study, bicycle riding was the most frequent injury mechanism for the sports cohort and was associated with the highest costs for younger boys and girls. Additionally, the highest mean per-patient costs were associated with motorcycle riding for younger boys and horse riding for younger girls. While rugby was the most frequent injury mechanism for older boys, motorcycle riding had the highest mean and total acute costs. For older girls, horse riding was associated with the most head injuries and the highest total acute costs, and motorcycle riding with the highest mean per-patient costs. Education programmes on safe riding practices and protective gear are needed to reduce sports-related TBIs.25
Prior research has shown that helmet laws and the proper use of helmets reduce head injuries and fatalities from bicycle riding.26–31 For the sports cohort, 52% of children with TBIs from bicycle riding were reported to be wearing helmets, accounting for 37% of bicycle-related acute care costs. Although we only obtained information regarding helmet use with bicycle riding, the effect of helmet use on reducing TBIs with other wheeled sports is strongly supported by research.32 33 The impact of helmet legislation on reducing fatalities from motorcycle and bicycle riding has been shown globally.34 In Australia, helmets are required for motorcycle and bicycle riding for all ages.35 In the UK, helmet use is required for motorcycle riding for all ages.36 Helmets are only recommended for riding bicycles, all-terrain vehicles, scooters or skateboards. In the USA, state and local laws are responsible for helmet legislation, and there are no helmet laws for bicycle riding in 29 states and motorcycle riding in 3 states.29 37 While helmet laws are necessary for reducing mortality from sports activities, our results indicate that additional strategies are required to reduce head injury severity.
This study is not without some limitations. First, we focused on acute care costs of sports-related TBIs from the Australian publicly funded health system perspective. We did not consider the number of contact hours associated with individual sports or the costs associated with long-term follow-up and rehabilitation, which would increase the total costs of these injuries. Second, we did not collect information regarding helmet use during non-bicycle activities or if the TBIs occurred from recreational or organised sports. Third, the high acute costs of severe TBIs could be associated with multiorgan injuries, which we did not evaluate. However, because individual cost inputs were applied (online supplemental appendix 1), this would only be reflected in the length of hospital stay.7 Fourth, the proportion of TBIs due to sports activities is likely underestimated because not all patients present to tertiary EDs after head injuries. Prior research has shown that about 25% of ED presentations for children in Australia occur at tertiary referral centres.38 APHIRST enrolled children across 10 tertiary referral hospitals in Australia and New Zealand, possibly under-representing rural and indigenous populations. Additionally, the rates of mild TBIs are likely underestimated because most of these children are not seen in EDs and are managed at home or by general practitioners.39 Therefore, the acute care costs and TBIs reported with sports and other mechanisms may not be generalisable beyond tertiary referral EDs.
Conclusion
Sports activities are common mechanisms of TBIs in children and have a significant economic impact on patients and the health system. Injury prevention strategies should focus on age-related and sex-related sports activities to reduce the burden of TBIs in children. We highlight the effect of TBI severity on the associated acute costs of head injuries from wheeled sports in children. This has implications for resource allocations for population-based injury surveillance and targeted injury prevention programmes.
Data availability statement
All data relevant to the study are included in the article or uploaded as supplementary information.
Ethics statements
Patient consent for publication
Ethics approval
This study involves human participants and was approved by the human research ethics committee of the Royal Children’s Hospital, Melbourne (reference 31008A) and the institutional ethics committees at the participating sites approved the study. Participants gave informed consent to participate in the study before taking part.
Acknowledgments
We thank the participating families and emergency department staff at participating sites. We thank Meredith L Borland (Perth Children’s Hospital, Perth, Western Australia); Stuart R Dalziel (Starship Children’s Health, Auckland, New Zealand, and Departments of Surgery and Paediatrics: Child and Youth Health, University of Auckland, Auckland, New Zealand); Ed Oakley (Royal Children’s Hospital, Melbourne, Victoria); Amit Kochar (Women’s & Children’s Hospital, Adelaide, South Australia); Natalie Phillips and Yuri Gilhotra (Queensland Children’s Hospital, Brisbane, Queensland); Sarah Dalton and Mary McCaskill (The Children’s Hospital at Westmead, Sydney, New South Wales); Jeremy Furyk (The Townsville Hospital, Townsville, Queensland); Jocelyn Neutze (Kidzfirst Middlemore Hospital, Auckland, New Zealand); Mark Lyttle (Bristol Royal Hospital for Children, Bristol, UK, and Academic Department of Emergency Care, University of the West of England, Bristol, UK); Silvia Bressan (Department of Women’s and Children’s Health, University of Padova, Padova, Italy); and Louise Crowe (Murdoch Children’s Research Institute, Melbourne, Victoria) for their involvement with obtaining the data and prior data analysis.
References
Supplementary materials
Supplementary Data
This web only file has been produced by the BMJ Publishing Group from an electronic file supplied by the author(s) and has not been edited for content.
Footnotes
Twitter @SoniaSinghPEM
Contributors SS conceptualised the study, conducted the analysis, wrote the first draft of the manuscript, reviewed and revised the manuscript, and is responsible for the overall content. FEB conceptualised and designed, coordinated and supervised data collection of APHIRST, contributed to data interpretation, and critically reviewed and revised the manuscript. SS, JAC, and KD acquired the cost data and conducted the analysis. SH had full access to the data, analysed the data, contributed to data interpretation, and critically reviewed and revised the manuscript. JSH, KD, JAC, JH, VA and NK contributed to the interpretation of the data and reviewed and revised the article critically. All authors revised the paper critically and approved the final manuscript as submitted.
Funding The study was funded by grants from the National Health and Medical Research Council (project grant GNT1046727, Centre of Research Excellence for Pediatric Emergency Medicine GNT1058560), Canberra, Australia; the Murdoch Children's Research Institute, Melbourne, Australia; the Emergency Medicine Foundation (EMPJ-11162), Brisbane, Australia; Perpetual Philanthropic Services (2012/1140), Australia; Auckland Medical Research Foundation (number 3112011) and the A+ Trust (Auckland District Health Board), Auckland, New Zealand; WA Health Targeted Research Funds 2013, Perth, Australia; the Townsville Hospital and Health Service Private Practice Research and Education Trust Fund, Townsville, Australia; and supported by the Victorian Government's Infrastructure Support Program, Melbourne, Australia.
Competing interests None declared.
Patient and public involvement Patients and/or the public were not involved in the design, conduct, reporting or dissemination plans of this research.
Provenance and peer review Not commissioned; externally peer reviewed.
Supplemental material This content has been supplied by the author(s). It has not been vetted by BMJ Publishing Group Limited (BMJ) and may not have been peer-reviewed. Any opinions or recommendations discussed are solely those of the author(s) and are not endorsed by BMJ. BMJ disclaims all liability and responsibility arising from any reliance placed on the content. Where the content includes any translated material, BMJ does not warrant the accuracy and reliability of the translations (including but not limited to local regulations, clinical guidelines, terminology, drug names and drug dosages), and is not responsible for any error and/or omissions arising from translation and adaptation or otherwise.