


The gaps in Flemish preschoolers' diet have already been discussed in depth by comparing their nutrient and food intakes with, respectively, the Belgian age-specific RDA for nutrients(Reference Huybrechts and De Henauw1) and the Flemish food-based dietary guidelines (FBDG) for preschool children. A complementary approach to assessing compliance with nutrition and food guidelines consists of obtaining an overall dietary index, which has the added value of considering the complexity of food consumption patterns and their multidimensional nature(Reference Guthrie and Scheer2–Reference Patterson, Haines and Popkin5). In this respect, indices based on nutrients, foods and a combination of both have been proposed(Reference Kennedy, Ohls and Carlson3, Reference Patterson, Haines and Popkin5–Reference Waijers, Feskens and Ocke8). Some of these indices have shown an association with mortality risk, CVD and some types of cancers, which was of greater magnitude than that observed for any nutrient or food at an individual level(Reference Kant9, Reference Osler, Heitmann and Gerdes10). Specifically, the healthy eating index(Reference Kennedy, Ohls and Carlson3), based on the USA dietary guidelines, has been used successfully in both adults and children to study their overall dietary quality(Reference Bowman, Lino and Gerrior11). This healthy eating index was developed based on a ten-component system of five food groups, four nutrients and a measure of variety in food intake.
Each of the ten components has a score ranging from 0 to 10, so the maximum possible index score is 100. This healthy eating index was calculated using data from a 24 h diet recall in combination with a 2 d dietary record(Reference Kennedy, Ohls and Carlson3).
Although quick and easy methods such as a brief FFQ can be used for measuring the intake of foods and/or food groups only(Reference Serdula, Alexander and Scanlon12), more detailed and labour-intensive dietary assessment methods such as dietary records or recalls are required for measuring different nutrient intakes accurately(Reference Willett13).
Since FBDG are based on nutrient recommendations, children complying with the FBDG could be assumed to comply better with nutrient recommendations in comparison with children not meeting the FBDG. Consequently, a FFQ assessing the intake of foods and/or food groups might be a useful alternative for estimating usual diet quality of young children when diet records are not feasible for the study population(Reference Serdula, Alexander and Scanlon12, Reference Parrish, Marshall and Krebs14).
Therefore, a diet quality index (DQI) for preschool children to be calculated from a forty-seven-item FFQ was developed as a tool for assessing the compliance of Flemish preschoolers with the Flemish FBDG in a quick and accurate way(15). The basic principles of a healthy diet in the Flemish FBDG include ‘equilibrium (adequacy and moderation)’ and ‘variation/diversity’. Additional guidelines concern the ‘meal pattern’ (which should include at least three main courses (breakfast, lunch and dinner)) and the ‘quality of the food items’ consumed. The DQI for preschool children considered these four basic principles for a healthy diet.
The aim of the present study was twofold: first, it was investigated whether this DQI for preschool children was able to measure what it was intended to measure (namely the quality of the diet) by comparing the DQI scores derived from 3 d records with nutrient intake profiles also derived from these 3 d records. Second, the validity of FFQ-based DQI scores (FFQ DQI) for preschool children was assessed by comparing the results of a FFQ-based DQI with a 3 d record-based approach.
Methods
Development of the FFQ-based diet quality index for preschoolers
A semi-quantitative FFQ was developed to compare preschool children's food intake in Flanders (Belgium) with the Flemish FBDG(15). This FFQ contained questions on the average consumption of forty-seven food items during the past year. The contents and relative validity of this FFQ have been described elsewhere(Reference Huybrechts, De Bacquer and Matthys16). In summary, the parents were asked to indicate their answers in a list of frequencies: every day; 5–6; 2–4; 1 d/week; 1–3 d/month; never or < 1 d/month. The questionnaire also contained three or four daily portion size categories per food item and a list of common standard measures as examples. Parents were asked to indicate the portion size category that best fitted the daily portion of their child. Dietary data from the FFQ were converted to average daily intake values (e.g. 1 serving/week = 0·14 serving/d).
Based on the Flemish FBDG(15), the DQI for preschool children was developed. The major components of this DQI are dietary diversity, dietary quality, dietary equilibrium and meal patterns. Although a brief description of these major components is given below, details about the technical aspects of the DQI are given in Tables 1 and 2.
Table 1 Description of the newly developed dietary quality index (DQI) for preschool children and its index components

FG, food group; FBDG, food-based dietary guidelines.
* Main/essential food groups (FG) included in the FBDG are beverages (non-sugared and no milk); bread and cereals; potatoes and grains (no crisps); vegetables (no juices and soups); fruit (no juices); milk products; cheese; meat, game, poultry, fish and meat replacements.
† For dietary excess, three additional food groups that are not included in the essential food groups are considered: snacks; sugared drinks (soft drinks); fruit juice.
Table 2 A theoretical example of the diet quality index (DQI) calculations
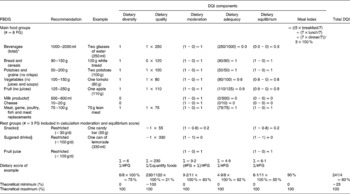
FBDG, food-based dietary guidelines.
* All drinks (but no milk products and no drinks from rest group).
† Milk, sugared milk drinks, yoghurt, milk deserts and Ca-enriched soy drinks.
‡ Sweet snacks, salty snacks (e.g. chips), chocolate and brioches, sweet deserts (e.g. ice cream and chocolate mousse), upper limit set at 30 g/d.
§ Sugared drinks (e.g. tea with sugar added) and soft drinks, but no fruit juices, upper limit set at 100 ml/d.
Dietary diversity
Dietary guidelines almost universally list consumption of a variety of foods as the number one recommendation. Therefore, the consumption of at least one serving of food per day from each of the eight recommended food groups illustrated in the Flemish food triangle(15) is our first dietary guideline.
Dietary quality
Within each food group, food items differ in nutrient and energy density. In the Flemish FBDG, products within a food group have been categorised into three groups: food items that are preferred in the ‘preference group’ (e.g. fresh fruit and cereal/brown bread), food items that may be consumed in the ‘moderation group’ (e.g. white bread); food items that should be avoided in the ‘low-nutritious, energy-dense group’ (e.g. soft drinks and sweet snacks). If a child consumes one portion from each food group, he or she will have the maximum diversity score. However, this does not necessarily imply that this child has made the optimal quality food choices within each food group. Therefore, the ‘dietary quality’ component was introduced in the DQI scoring system for preschool children.
Dietary equilibrium: adequacy and moderation
Dietary guidelines stress on an adequate intake of key foods such as fruits and vegetables, but they also encourage moderation, especially in intakes of nutrient-poor energy-dense foods. A diet is in balance when an adequate but moderate intake of each element of the FBDG is reassured. Therefore, the dietary equilibrium factor is disaggregated into ‘adequacy’ and ‘moderation’. These distinctive categories help users to readily identify dietary aspects that need to be improved the most.
Meal index
A healthy diet implies also the consumption of a certain number of meals per day. Although children are recommended to have smaller but more frequent meals (up to 6/d), only the three major meals (breakfast, lunch and dinner) were assessed in the FFQ. Evidence shows an important influence of meals on individuals' health. Skipping breakfast was found to be associated with a higher risk for obesity(Reference Dubois, Girard and Potvin17) and lower attention or concentration capacities(Reference Benton and Jarvis18–Reference Fernald, Ani and Grantham-mcgregor20). In addition, low meal frequencies and a high energetic late-evening dinner were found to be associated with overweight and obesity(Reference Maffeis, Provera and Filippi21, Reference Toschke, Kuchenhoff and Koletzko22). Therefore, this fourth component was added to the DQI for preschool children. This meal index was calculated from the frequency variables ‘breakfast’, ‘lunch’ and ‘dinner’, representing the number of days per week that these meals were consumed.
To compute the overall DQI for preschool children, the scores of the four major categories were summed and divided by 4, resulting in scores ranging from − 25 to 100 %. Although a child theoretically can reach a DQI score below zero, negative scores can only be achieved when a child only consumed food items from the group of low-nutritious, energy-dense foods (e.g. soft drinks and candies). The better a child complies with the FBDG, the higher the total DQI with a maximum of 100 %.
Study design
To assess the relative validity of the DQI for preschool children, data of children, included in a large-scale cross-sectional epidemiological study investigating nutrition habits of Flemish preschoolers (2·5–6·5 years old), were used. A detailed description of the methodology used in the present study has been given elsewhere(Reference Huybrechts, De Bacquer and Matthys16). In brief, the sampling design included a combination of stratification and multistage sampling techniques, using schools as primary sampling units and classes as secondary sampling units. Within the forty-three schools participating in the present validation study, a total of 2095 children were invited to participate.
Parentally reported estimated diet records, completed over three consecutive days, were chosen as reference. In these 3 d records, days were subdivided into six eating occasions, and detailed information on type (including brand names) and portion size of the foods consumed was collected using an open entry format(Reference Huybrechts, Matthys and Pynaert23). After collection, the 3 d records were coded and entered into a ‘Diet Entry & Storage’ programme (BECEL(24)), which automatically calculated nutrient intakes. Daily food intake data were grouped into the food-based 3 d record DQI dietary components after disaggregating recipes (e.g. spaghetti) and aggregating ingredients from mixed recipes (e.g. when parents described homemade bread as a recipe).
The directors of the schools and/or teachers of the classes that participated in the study were given detailed information and instructions about the study. Efforts were made to include the help of schoolteachers in reporting snacking and lunches consumed during school time. Schools participating in the validation study distributed the food diaries 1 week after the collection of the FFQ. In the questionnaire and the food diaries, detailed instructions were given for the parents. From the 2095 invited children, 1579 FFQ and 1052 3 d records were collected by the end of the fieldwork.
For the reproducibility study, 244 children were selected in a separate convenient sample of three nursery schools in the province ‘East Flanders’. Schools participating in the reproducibility study distributed a second FFQ 5 weeks after the collection of the first FFQ. In total, 169 subjects completed the FFQ during the first administration, of whom 124 completed the second FFQ also.
The fieldwork of the validation and the reproducibility study was carried out from October 2002 to February 2003. The ethical committee of the Ghent University Hospital granted ethical approval for the study, and written informed consent was obtained from all subjects.
Statistical analysis
Only good quality food diaries, including three completed record days and containing sufficiently detailed descriptions of the food products and portion sizes consumed, were included in the analysis. Two dietitians, with long-standing experiences in nutritional epidemiological fieldwork, carried out the exclusion procedure of the 3 d records. More details about the exclusion procedure are given elsewhere(Reference Huybrechts, Matthys and Pynaert23). In total, the food diaries of 356 children were excluded, resulting in a final sample of 696 diaries for the validation study.
Furthermore, the FFQ of seventy-two children had to be excluded completely, since less than half of the questions had been answered. Moreover, since no missing values were replaced, a child's diet quality score or component could only be computed when the respondent filled out a frequency and portion size for all the food groups included in the DQI calculation. Therefore, the total number of FFQ that were of use for the validity analysis of FFQ DQI was reduced from 1579 to 1065, and for the reproducibility study, it was reduced from 124 to 58. Combining the FFQ with the 3 d records, the data of 510 children remained of use for the validity analysis.
To examine whether the DQI for preschool children actually measures what it is intended to measure, namely the quality of the diet, the DQI scores from the 3 d records were compared with nutrient intakes derived from 3 d records. This comparison was done using Pearsons correlations.
In addition, the relative validity of the FFQ-based DQI for preschool children was assessed by comparison with the 3 d records. In the present validity study for each dietary assessment method, the average of the DQI score and its subscores were calculated. Tests for normality were performed using the Kolmogorov–Smirnov test. For both the methods, DQI score distributions were normally distributed.
Differences between mean scores were tested using the paired t test. Associations between the two methods were described using Pearson's correlations corrected for within-individual variation. Agreement between the 3 d record and FFQ at an individual level was assessed using mean difference and standard deviation of the difference, which was visually shown in a Bland & Altman plot(Reference Bland and Altman25). Even though analyses based on quartiles provided similar conclusions, individual results for the DQI estimated by the 3 d record and FFQ were classified into tertiles to assess the questionnaire's ability to assign individuals to the same tertile as the 3 d record(Reference Willett13). The percentage classified into the correct or adjacent tertile and the percentage grossly misclassified were calculated. Agreement has also been assessed using the weighted κ statistic, which was calculated with a linear set of weights(Reference Altman26). To assess the measurement error of the FFQ, ‘actual values for surrogate categories’ were calculated(Reference Willett13) as follows: participants were assigned to tertiles according to DQI scores estimated by the FFQ, and then the mean DQI score in each tertile was calculated using data determined by the 3 d record method. This gives an indication of the ‘true’ (3 d record) values that are indicated by the FFQ tertiles. One-way ANOVA was used to determine whether differences between tertiles were statistically significant.
For the reproducibility of the FFQ in measuring diet quality, paired t test, Pearsons correlation coefficients, weighted κ and cross-classification analysis for DQI scores between the first and the second FFQ administration were measured.
The SPSS for Windows version 14 (SPSS, Inc., Chicago, IL, USA) was used to carry out all statistical analyses.
Results
In Table 3, the correlation coefficients comparing DQI scores and subscores from the diet records with nutrients from the diet records are presented. DQI scores for preschool children were inversely correlated with carbohydrates and more, in particular, with simple sugars. DQI scores for preschool children were also directly related to vitamins B1 and B2, fibre, Mg, P, Ca, protein and water intakes. In addition, the DQI was also correlated positively with SFA intakes and negatively with total fat intakes (although both these findings were not statistically significant).
Table 3 Pearsons correlations of nutrient intakes with the 3 d record dietary quality index (DQI) and the different subscores (all results in this table are based upon the 3 d record data)

* Correlation is significant at the 0·05 level (two-tailed).
† Correlation is significant at the 0·01 level (two-tailed).
For what concerns the subscores, we found that the dietary diversity score was mainly (positively) associated with the micronutrients and with total water, fibre, protein and SFA intakes. The dietary quality score is negatively associated with energy, MUFA and carbohydrate intakes, while it was positively associated with many micronutrient intakes, protein, water and fibre intakes. The dietary equilibrium score was inversely correlated with energy, total fat, carbohydrate, MUFA and PUFA intakes, while it was positively correlated with protein, fibre, water, riboflavin, Ca, P, Mg and Zn intakes. The meal index was positively associated with energy, PUFA, complex carbohydrates, fibre, Na, Fe and Mg intakes, and was not significantly associated with any of the nutrients.
The distribution of scores for the total DQI and its major individual components as estimated in the reproducibility and validity studies are summarised in Tables 4 and 5.
Table 4 Test–retest reliability of the FFQ DQI scores: mean FFQ DQI scores based on test and retest FFQ, significance of the difference, weighted κ statistics based on tertiles and correlation between both measurements
(Mean values and standard deviations)
NA, not applicable since almost all children scored 100 %.
* Paired samples t test.
Table 5 Relative validity of the FFQ diet quality index (DQI) score and subscores compared against the 3 d record DQI score and subscores: mean FFQ and 3 d record DQI scores, significance of the difference, weighted κ statistics based on tertiles and correlation between both measurements
(Mean values and standard deviations)
NA, not applicable since almost all children scored 100 %.
* Paired samples t test.
No significant differences in mean DQI scores for preschool children were found between repeated measurements in the reproducibility study. However, in the validity study, significant differences were found between mean DQI scores calculated from the FFQ (71 %) and the 3 d record (66 %), respectively. The Bland & Altman(Reference Bland and Altman25) plot in Fig. 1 shows that the FFQ on average overestimates the DQI score (with 5 %) in comparison with 3 d records and assessed DQI scores from 20 % above to 10 % below the 3 d record.

Fig. 1 Differences between the mean diet quality index (DQI) scores for preschoolers for the 3 d record and the FFQ in the validation analyses.
A reproducibility correlation of 0·88 was obtained when comparing DQI scores from FFQ1 with those from FFQ2. Reproducibility correlations between the two FFQ for individual index components ranged from 0·63 to 0·85. The validity correlation for the DQI score corrected for within-individual variability was 0·82. Pearsons correlations varied among the four main components of the DQI (from 0·39 to 0·74; Tables 4 and 5).
In both methods, breakfast was the meal score component (meal frequency per week/7 d × 100 %) showing the lowest mean submeal score (89 % for 3 d records and 83 % for FFQ), while the mean lunch and dinner score was >95 % for both methods.
Cross-classification analysis of the FFQ and the 3 d record-based DQI scores classified 60 % of the subjects in the same category and 3 % in extreme tertiles (Table 6). Cross-classification of repeated administrations classified 69 % of the subjects in the same category and 3 % in extreme categories (Table 6). To assess the measurement error of the FFQ, ‘actual values for surrogate categories’ were calculated(Reference Willett13). Actual values for surrogate FFQ tertiles showed a progressive increase in DQI score (P < 0·001; Table 7).
Table 6 Cross-classification analysis for the diet quality index (DQI) for preschool children
* 3 d record/FFQ1.
† FFQ.
‡ FFQ2.
Table 7 Use of actual values for surrogate categories to compare the diet quality index (DQI) score of the FFQ with the 3 d record
(Mean values and standard deviations)

* ‘True mean values’ based on the 3 d records were assigned to the categories defined by the surrogate method (FFQ) and compared (ANOVA).
Discussion
A DQI for preschool children, which is to be calculated from a forty-seven-item FFQ, has been developed as a tool for assessing the compliance of Flemish preschoolers with Flemish FBDG in a quick way. The validity of this new index was assessed by comparing the DQI scores derived from 3 d records with nutrient intake profiles also derived from these 3 d records. The validity of a FFQ for calculating these DQI scores for preschool children was assessed by comparing the results of a FFQ-based DQI with a 3 d record-based approach. This is the first study in Flemish preschoolers that has formally tackled these questions simultaneously, including the task of calculating an index of overall diet quality and checking its validity against nutrient intake.
Total DQI scores and its subscores calculated from 3 d records were mainly correlated with nutrients in the expected direction. Increasing DQI scores for preschool children were associated with decreasing consumption of simple carbohydrates, and increasing intakes of fibre, water, Ca and most of the micronutrients. Also, the dietary diversity and dietary equilibrium scores were are positively associated with fibre, water and most of the micronutrient intakes. Although the positive correlation between SFA and DQI scores for preschool children might be unexpected, from previous analyses it could be concluded that the dairy intakes in accordance with the recommendations for preschool children are mainly responsible for these high SFA intakes. Interesting was the fact that the DQI for preschool children was inversely associated with energy intake, assuming that not only large food intakes reassured high diet quality in preschoolers. The latter finding is in contrast with other DQI validation studies where children consuming more food, and thus more total energy, were shown to have higher DQI scores since they are more likely to meet the intake recommendations compared with children who eat less(Reference Kranz, Hartman and Siega-Riz27, Reference Lowik, Hulshof and Brussaard28). The limited level of misclassification when using tertiles reveals that the FFQ-based DQI is a useful tool for categorising children in groups according to diet quality.
Although in the reproducibility study, mean DQI scores and subscores estimated from FFQ1 and FFQ2 were not significantly different, important differences were found between the mean DQI estimated from the FFQ and 3 d records. These significant differences in mean DQI scores might indicate limited usefulness of the absolute DQI scores. However, the main purpose of our FFQ-based DQI is to rank individuals according to their DQI score. The Pearsons correlation coefficient for the total DQI score (0·82) was high in comparison with other DQI validation studies(Reference Newby, Hu and Rimm29), showing good correlation between, respectively, the FFQ and 3 d record-based approach for this newly developed DQI for preschool children. The weak validity correlation for meal index (r 0·44) may have been due to limited variation in meal pattern, because most preschoolers met the goal for three meals daily according to both FFQ and diet records. Also, the low standard deviations found for the DQI scores and subscores (except for the diet quality subscore) might possibly be explained by low between-individual variation in preschool-aged children's diet(Reference Huybrechts, De Bacquer and Cox30).
Methodological considerations
Although replacement of missing values can be used when calculating DQI scores, in this validation study, where representativeness of the study sample is less important than in monitoring surveys evaluating population's dietary intake, only the FFQ for which all questions had been answered was decided to be used. The selection bias of the present study sample was estimated previously, and although it was showing good geographical representativeness, a possible bias caused by higher participation rates of higher educated parents should be considered(Reference Huybrechts, Matthys and Pynaert23). Therefore, the results presented in the present study should be seen as an optimal situation in which the respondents who were included in the analysis were all able to answer all the questions in the FFQ and were also capable of recording their child's food intake during three consecutive days, providing sufficiently detailed information about the foods and portion sizes consumed. The distribution of the recorded days over the different days of the week was also published previously(Reference Huybrechts, Matthys and Pynaert23). Although all days of the week were represented in the total sample of diet records, Mondays, Tuesdays and Sundays were somewhat underrepresented.
We compared the DQI scores from the FFQ with estimates by diet records because diet records have among the lowest correlated errors with FFQ, and are therefore the most widely used dietary assessment method for validating a FFQ(Reference Willett13). Since both methods contain a certain degree of error, the limitations of both dietary assessment methods must be considered in the assessment of diet quality when interpreting results generated from different methods. The main disadvantage of the 3 d record, for instance, is that 3 d records do not represent the usual dietary intakes for most of the nutrients. A more in-depth discussion about this within-person variability of dietary intakes was published before(Reference Huybrechts, De Bacquer and Cox30). An important limitation of the FFQ is the limited amount of details that can be collected (brand name information can seldom be captured by FFQ, and portion size estimations are even more difficult to be captured than for 3 d records as they need to represent the usual daily portion sizes). Therefore, the low correlations found for the dietary equilibrium component might be due to the difficulty in estimating portion sizes in both instruments. Also, the limited accuracy of the absolute DQI scores between the two different administration methods might be caused by a certain (little correlated) degree of error in both instruments. Furthermore, the underreporting of foods perceived as less healthy (e.g. biscuits) and the overreporting of dietary components perceived as relatively more healthy (e.g. fruit) as generally seen in FFQ might contribute to the higher total DQI scores found in the FFQ than in the diet records(Reference Rimm, Giovannucci and Stampfer31, Reference Feskanich, Rimm and Giovannucci32).
In contrast with many other diet quality indices, our DQI for preschool children was not based on nutrient intakes. Although calculations of nutrient intakes are necessary in order to estimate nutrient inadequacies, one can assume that a child following the FBDG for children should have an adequate intake of most nutrients, given the fact that FBDG are supposed to be based on nutrient recommendation. In the present study, it was roughly estimated whether the DQI score actually measures what it is intended to measure, namely the quality of diet, by comparison with nutrient intakes derived from the 3 d record. Except for a positive correlation found with SFA intakes, the correlations found between the DQI and most other nutrients were in line with the expectations for a DQI that is supposed to reflect an optimal diet quality. However, whether FBDG are sufficiently tuned to the nutrient recommendations remains a question that urgently needs to be tackled in future research.
Although more recently, the aspect of physical activity was also added to this triangle, and this component has not been taken into account in our DQI since our intent was to design an index that focused on the potential benefits of a healthy diet to ascertain whether the current dietary recommendations might, after accounting for physical activity, affect the risk of major chronic diseases. Thus, rather than including this physical activity factor in the index, we suggest that it is adjusted for in analyses using the DQI to lessen the possibility that adherence to the dietary recommendations of the DQI would be confused by physical activity. Besides, it is important to note that the impact of the different subscores on health is unknown. Therefore, we did not include weighing factors for the subscores when calculating the total DQI score.
Furthermore, it should be noted that even though estimation of energy expenditure would have been useful to evaluate energy balance, the FFQ was not developed for estimating energy intakes and consequently not for calculating energy balance. While energy intake would be a useful parameter to calculate energy balance, both energy intake and expenditure are very difficult to measure accurately in preschool children. Small biases in each of the macronutrients contributing to total energy intake might result in an important bias in total energy intake.
In addition, high-energy intakes in preschool children are not necessarily the major risk factor for chronic diseases in later life since preschoolers are still recommended to have a diet rich in fatty acids (preferable PUFA) in order to foresee in the needs for growth and the development(Reference Vobecky, Vobecky and Normand33). Recent evidence suggests that mainly the glycaemic index of foods would be associated with risks for insulin resistance and associated diseases like diabetes, CVD and obesity in later life(Reference Lustig34). An advantage of a score based only on FBDG and not on nutrients is that no food composition data need to be used, which is also likely to include a certain bias.
As mentioned before, variation in our diet is one of the most important universally listed dietary guidelines. Although children are recommended to use food items from all eight food groups recommended in the food triangle on a daily basis, they are further recommended to increase the variation of food items within each group of the food guide triangle. So children, for instance, are recommended to vary between different fruit types in order to foresee a broad range of micronutrients in which the nutrient-specific density differs importantly from fruit type to fruit type. Although it would be better to include more food groups in the dietary diversity score, the limited number of food categories in our FFQ forced us to limit the diversity score to the minimum recommended dietary diversity presented by the different food groups recommended in the food triangle.
Assessment of reproducibility and validity of an instrument such as the DQI is only one step in the evaluation of a dietary assessment method. Whether the index or other measures of diet quality can predict disease across diverse populations is the ultimate test of validity. A review of diet quality indices found that diet quality was related to the risk of disease more strongly than individual nutrients or foods(Reference Kant9), but recent studies examining the relation have led to inconsistent results(Reference Nube, Kok and Vandenbroucke4, Reference Drewnowski, Henderson and Shore35–Reference McCullough, Feskanich and Stampfer37). The inconsistencies could be attributable to specific components included in the indices that may not be clearly associated with disease risk. For the DQI, consuming 30 % of total energy from fat is one of the components, but total fat intake may not be associated with either CVD(Reference Hu, Stampfer and Manson38) or cancer(Reference Willett and Trichopoulos39). As such, DQI based on current FBDG may be limited in utility if FBDG itself do not reflect current nutrition knowledge. In addition, an index that is based on current guidelines may become outdated as nutrition science evolves. DQI, then, is only as good as the components on which it is based; hence, it inevitably must be revised if it is truly to reflect the latest nutrition science and guidelines.
Although this DQI has been developed for use in children, it can be adapted for use in adults by implementation of the FBDG for adults.
Conclusion
The present study showed good reproducibility and validity of the FFQ-based DQI for preschool children, and the correlations with nutrients calculated from the 3 d record were similar for many of the nutrients, indicating that the FFQ-based DQI score is a reasonable estimate of diet quality when compared with 3 d diet records. Although FFQ are not as accurate in assessing absolute intakes as are multiple diet records, the reasonable correlations observed indicate that children can be ranked with sufficient accuracy with respect to diet quality. Although the present findings of reasonable reliability and validity of the DQI scores are positive, they do not necessarily mean that this index is useful in predicting disease outcomes among persons who comply with the recommendations. Studying whether the DQI can reliably predict disease risk is the next step in the validation of its utility as a dietary assessment method.
Acknowledgements
We thank Mia Bellemans and Mieke De Maeyer, the dietitians of our team, for the data input and their contribution to the conceptualisation of the FFQ. Funding for the present project was provided by the Belgian Nutrition Information Center. C. V. is a postdoctoral researcher funded by the FWO-Flanders. The authors declare that there are no conflicts of interest. I. H. was responsible for the food intake assessments and the writing of the manuscript. Moreover, I. H. and S. D. H. were responsible for the study protocol and the fieldwork. C. V., D. D. B., L. M. and E. V. assisted in the conceptualisation of the dietary quality index. All other authors (S. V., H. V. O., L. T. and G. D. B.) helped in the evaluation of the results and the writing of the manuscript. All authors have read and have approved the manuscript as submitted.


