


Childhood obesity is a major and increasing public health concern in the UK and worldwide. In England, 28% of children aged 2–15 years are overweight, including 15% who are obese(1). Obese children are more likely to suffer from medical conditions such as type 2 diabetes, sleep apnoea and CVD(Reference Raj2). They are also more likely to face socio-emotional difficulties such as discrimination and social marginalisation(Reference Sahoo, Sahoo and Choudry3).
In the UK, the general quality of diet in children is poor, including during early childhood. UK children between the ages 1·5 and 3 years, on average, consume more than double the maximum 5% energy intake from free sugars that is recommended by the Scientific Advisory Committee on Nutrition(Reference Roberts, Steer and Maplethorpe4). They also consume nearly one-third more than the recommended percentage energy intake from saturated fat(Reference Roberts, Steer and Maplethorpe4). In addition, only 18% of children between the ages 5 and 15 years eat the recommended five or more portions of fruit and vegetables a day(5). When obesity develops in childhood, it significantly increases the odds of obesity in adulthood(Reference Simmonds, Llewellyn and Owen6). Therefore, addressing the causes of poor diet and obesity early in life is vitally important in reducing the prevalence and impact of obesity.
Maternal overweight/obesity is a significant risk factor for childhood obesity(Reference Whitaker, Jarvis and Beeken7). In England, the odds of childhood obesity more than doubles if a child has two overweight parents compared with a child with two healthy weight parents(Reference Whitaker, Jarvis and Beeken7). A number of transgenerational risk factors likely contribute to this relationship, such as parental influences over their child’s diet, physical activity, behaviour and genetic vulnerability(Reference Thompson8). Obese mothers are also less likely to breastfeed, and do so for a shorter duration, than non-obese mothers(Reference Amir and Donath9). Despite these findings, few studies have explored how the solid food diets of children with overweight/obese parents compare with those of children with healthy weight parents.
A previous study in the Avon Longitudinal Study of Parents and Children (ALSPAC) showed that childhood diet quality significantly deteriorates from ages 18 months to 43 months and that this lower quality diet is maintained throughout childhood(Reference Emmett and Jones10). The primary aim of this study was to determine the association of maternal BMI classification on the quality of early childhood diet and risk of childhood obesity by exploring the effect on the consumption of core and non-core foods and soft drinks in children at ages 18 and 43 months, and on childhood BMI classification at 43 months of age. As a secondary aim, the predictive value of maternal BMI classification for a change in diet quality from ages 18 to 43 months was also explored.
Methods
Participants
ALSPAC is an observational prospective cohort study investigating influences on health and development across the life course(Reference Boyd, Golding and Macleod11,Reference Fraser, Macdonald-Wallis and Tilling12) . The cohort has been described in greater detail elsewhere(Reference Boyd, Golding and Macleod11,Reference Fraser, Macdonald-Wallis and Tilling12) . In brief, the study initially recruited 14 541 pregnant women in the former Avon Health Authority in south-west England, with an expected delivery date between April 1991 and December 1992. From these initial pregnancies, 14 676 fetuses were produced, resulting in 14 062 live births and a total of 13 988 children who were alive at 1 year of age (see online supplementary material, Supplementary Figure 1). The cohort has since collected health, lifestyle and dietary information, through questionnaires and clinical visits from these women and their resulting offspring. The cohort is broadly representative of the UK population, although the participants are slightly more prosperous and the cohort is under-representative of ethnic minority participants(Reference Boyd, Golding and Macleod11). The study website contains details of all the data that are available through a fully searchable data dictionary and variable search tool http://www.bris.ac.uk/alspac/researchers/data-access/data-dictionary.
Participants in ALSPAC’s Children in Focus (CiF) subsample, equivalent to 10% of the entire ALSPAC cohort, were selected from the last 6 months of ALSPAC births. The selected children along with their parents were invited to attend research clinics. These clinics took place in intervals from 4 months to 61 months of age, with 1432 children attending at least one clinic. Children from this subsample are biased towards having mothers with a higher educational attainment compared with the entire ALSPAC cohort (39·6% of children in CiF have mothers whose educational attainment was A levels (Advanced level) or above compared with 35·4% in the entire ALSPAC cohort(Reference Cribb, Northstone and Hopkins13)).
Exposures
Pre-pregnancy maternal BMI was derived from self-reported pre-pregnancy weight and height, from which BMI was calculated (weight/height2). A pre-pregnancy maternal BMI classification variable was derived from the WHO(14) categories: ‘overweight/obese’ (BMI ≥ 25 kg/m2) (ow/ob) or ‘healthy weight/underweight’ (BMI < 25 kg/m2) (hw/uw).
Outcomes
Dietary information was collected when the child was aged 18 months and again aged 43 months. Detailed methods have been described elsewhere(Reference Emmett and Jones10). In summary, parents were invited by post to complete structured food records, recording all food and drink their child consumed over three individual days (preferable including two weekdays and one weekend day). The food records were checked by a member of the nutrition team for completeness with the parent and to clarify any uncertainties.
Food and drink items from the food record were linked to weights and energy contents, and the data were grouped according to the concepts of ‘core’ or ‘non-core’ foods or soft drinks (see online supplementary material, Supplementary Table 1) based on the Australian Guide to Healthy Eating(Reference Roberts15). Core foods are described as those which provide the important nutrients the body needs; non-core food or ‘extra foods’ are described as those which are not necessary to provide the nutrients the body needs and often contain added fat, sugar or salt(Reference Roberts15) and soft drinks are non-alcoholic, non-dairy drinks with low nutrient content. The core food groups created were: (1) Fruit; (2) Potatoes, vegetables and legumes; (3) Unprocessed meat, fish, poultry and eggs; and (4) Cereal foods. The non-core food groups created were: (1) Processed meat, fish and poultry; (2) Potatoes cooked in fat; (3) Spreads, soups and sauces; and (4) Sweetened processed foods. Soft drinks were defined as a ‘cold sweet drink that does not contain alcohol’ and subdivided into three subgroups: (1) Unsweetened fruit juice; (2) Sugar-sweetened soft drinks; and (3) Artificially sweetened soft drinks (see online supplementary material, Supplementary Table 1).
The BMI of the children was measured at CiF clinics at 43 months of age. These were derived from weight and height measurements made by trained clinical staff using standardised procedures.
Confounders
Confounders were selected based on whether the characteristic occurred at about the same time as the exposure, were scientifically plausible as confounders and had a P-value < 0·2 in the baseline characteristic analyses.
Data collected on maternal characteristics from maternal completed postal questionnaires included age (years), maternal education, parity and whether the mother had ever breastfed this child. Birth weight (g) was obtained from medical records. Family Adversity Index was derived from responses to questions relating to measures of financial, social, emotional and physical adversity, which have been detailed elsewhere(Reference Crawley, Hughes and Northstone16). Scores range from 0 to 8. For maternal education, mothers were either categorised as having achieved Certificate of Secondary Education, vocational or O-level (Ordinary level) qualifications only, or as having achieved A-level, degree or higher qualifications. For maternal parity, mothers were either categorised as 0 (no previous births) or ≥1 (1 or more previous births).
Data analysis
All statistical tests were performed on Stata, version 15 (StataCorp). BMI classifications were calculated using the Zantho package in Stata. Maternal age, maternal education, parity and Family Adversity Index were used as covariates in all adjusted analyses.
Unpaired t tests and χ 2 tests were used to test for baseline characteristic differences between ow/ob mothers and hw/uw mothers.
Effect of maternal pre-pregnancy BMI class on diet at 18 and 43 months
The mean daily intakes of all core and non-core food and soft drink groups (weight and energy) were calculated using the dietary data available at 18 and 43 months of age, with the children categorised by maternal BMI class.
Multiple linear regression analyses were used to determine the association of maternal BMI classification with the daily mean energy intakes from total food, total core and non-core food and soft drinks at 18 months and 43 months.
Multiple linear regression analyses were repeated to determine the association of maternal BMI class with mean daily energy intakes from individual core and non-core food and soft drinks groups, and from individual macronutrients at 18 months and 43 months.
Odds of childhood being overweight/obese at 43 months
Logistic regression was used to determine the odds of a child being overweight or obese at 43 months if they had an ow/ob mother (maternal pre-pregnancy BMI ≥ 25 kg/m2). Child BMI classifications were based on the British 1990 growth reference centile curves(Reference Cole, Freeman and Preece17): overweight or obese defined as BMI ≤ 85th or 95th centile, respectively, of BMI within their age group and sex(Reference Dinsdale, Ridler and Ells18).
Changes in diet from 18 to 43 months
Paired t tests were used to determine the percentage change, from 18 to 43 months, of total energy intake from core and non-core food and soft drink groups. Linear regression analyses were undertaken to explore the effect of maternal ow/ob status on this percentage change from 18 to 43 months.
Results
Demographic characteristics of study group
The demographic characteristics of the study groups are shown in Table 1. In summary, ow/ob mothers had lower educational attainment (P < 0·001) than hw/uw mothers, they were more likely to not have ever breastfed (P < 0·001) and their babies had a greater birth weight (P < 0·001). They also had a higher Family Adversity Index, but the difference was weak (P = 0·061). There were no differences between the groups for smoking status, parity and age.
Table 1 Demographic characteristics of overweight/obese mothers compared with those with healthy weight/underweight mothers in the Avon Longitudinal Study of Parents and Children’s Children in Focus (ALSPAC-CiF)*
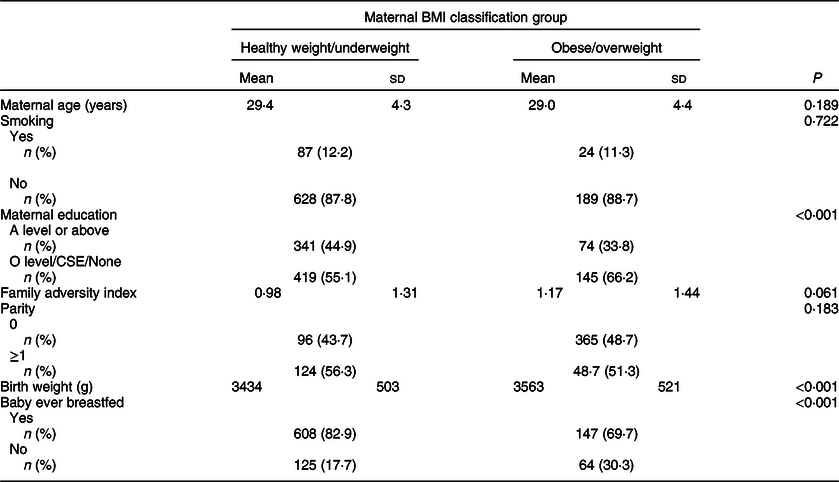
CSE, Certificate of Secondary Education.
* BMI classifications: healthy/underweight <25 kg/m2, overweight/obese ≥ 25 kg/m2.
Changes in diet from 18 to 43 months
Energy intakes in children at 18 and 43 months categorised by maternal BMI class are shown in see online supplementary material, Supplementary Table 2. As expected, total energy intake increased between 18 and 43 months by 23% for children with hw/uw mothers and by 21% for children with ow/ob mothers. However, energy intake from total non-core foods increased by a greater proportion in children with ow/ob mothers (non-core food energy intake increased by 68% amongst children with ow/ob mothers and by 58% amongst children with hw/uw mothers). There were many more consumers of soft drinks at 43 months than at 18 months. The percentage of consumers of sugar-sweetened drinks rose from 34% to 60% in both groups of children, while low energy/diet drinks went from 64% to 73% in children of hw/uw mothers and from 72% to 82% in those of ow/ob mothers.
Energy intake from total core and non-core foods
In adjusted models, total daily energy intake did not differ between children with ow/ob mothers and those with hw/uw mothers either at 18 months (P = 0·176) or at 43 months (P = 0·564). In addition, total daily core food energy intake did not differ between the two groups of children either at 18 months (P = 0·105) or at 43 months (P = 0·109) (Table 2).
Table 2 Differences in energy intake (MJ/d) from all foods, core and non-core foods and macronutrients in the Avon Longitudinal Study of Parents and Children’s Children in Focus (ALSPAC-CiF) children at 18 and 43 months of age with overweight/obese mothers compared with those with healthy weight/underweight mothers*,†,‡

* BMI classifications: healthy/underweight <25 kg/m2, overweight/obese ≥ 25 kg/m2.
† Reference group: children with healthy/underweight mothers.
‡ Conversion factor: 1 MJ is equivalent to 239 kcal.
§ Adjusted for maternal age, maternal education, parity and Family Adversity Index.
Children with ow/ob mothers had a greater daily mean intake of energy from non-core foods than children with hw/uw mothers at both 18 and 43 months of age. At 18 months, non-core energy intake was 0·20 MJ (48 kcal)/d (10·0%) greater (P < 0·001) and at 43 months, it was 0·19 MJ (45 kcal)/d (7·2%) greater (P = 0·008) (Table 2).
Energy intakes from macronutrients
In adjusted models, at 18 months of age, children with ow/ob mothers had a 0·06 MJ (14 kcal) (9·7%) greater daily mean intake of energy from free sugars than children with hw/uw mothers (P = 0·010) and a 0·06 MJ (14 kcal) (11·1%) lower energy intake from intrinsic sugar (P = 0·002) (Table 2). There were no differences in the other macronutrients (data not shown). By 43 months, there was no difference between the two groups of children in the daily mean energy intakes from any of the macronutrients (Table 2).
Energy intake from individual core and non-core food groups
In adjusted models for core foods at 18 months, only two food groups differed between the two maternal groups: total fruit (excluding fruit juice) energy intake was 14·8% (P = 0·012) lower and the yogurt, cheese and milk group was 7·7% (P = 0·037) lower in children with ow/ob mothers compared with those with hw/uw mothers (Table 3). There were no differences at 43 months.
Table 3 Difference in energy intake (MJ/day) from individual core and non-core food groups in the Avon Longitudinal Study of Parents and Children’s Children in Focus (ALSPAC-CiF) children at 18 and 43 months of age with overweight/obese mothers compared with those with healthy/underweight mothers*,†,‡
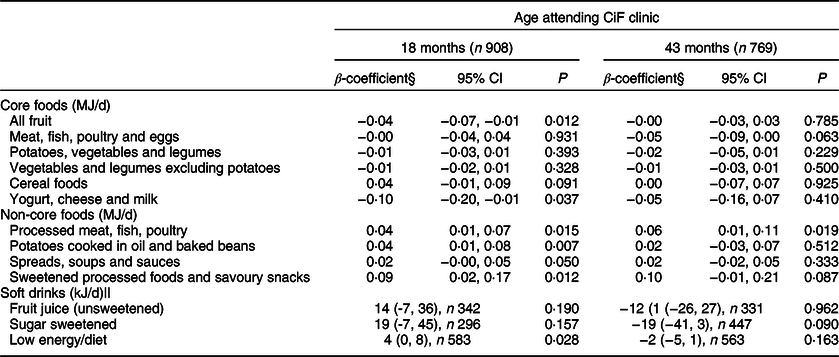
* BMI classifications: healthy/underweight <25 kg/m2, overweight/obese ≥ 25 kg/m2.
† Reference group: children with healthy/underweight mothers.
‡ Conversion factor: 1 MJ is equivalent to 239 kcal.
§ Adjusted for maternal age, maternal education, parity and Family Adversity Index.
|| Consumers only.
For non-core foods at 18 months, energy intakes from most of the food groups were greater amongst children with ow/ob mothers than children with hw/uw mothers: processed meat, fish, poultry (P = 0·015), potatoes cooked in oil and baked beans (P = 0·007), and sweetened processed foods and savoury snacks (P = 0·012) (Table 3). Energy intake from spreads, soups and sauces was marginally greater (P = 0·050) in children with ow/ob mothers (Table 3). At 43 months, the daily mean energy intake from processed meat, fish, eggs and poultry was greater amongst children with ow/ob mothers than those with hw/uw mothers (P = 0·019). There was weak evidence for greater energy intake from sweetened processed foods (P = 0·087) in children with ow/ob mothers (Table 3). There were no differences in the energy from unsweetened fruit juice or sugar-sweetened drinks between the two groups at either age (Table 3), and for low energy/diet drinks at 43 months. At 18 months, children with ow/ob mothers who were consumers of low energy/diet drinks consumed 4 kJ/d more energy from low energy/diet drinks than children of hw/uw mothers.
Change in energy intake from core and non-core foods from 18 to 43 months of age
Across all children, the percentage of total dietary energy intake from core foods decreased by 10·6% from 18 to 43 months (P < 0·001), whilst the percentage of total dietary energy from non-core foods increased by 10·9% (P < 0·001) (see online supplementary material, Supplementary Table 2). The percentage of energy from non-core foods in children with ow/ob mothers was 14·6% greater at 18 months and 9·3% greater at 43 months than in those with hw/uw mothers (Fig. 1). However, these changes were of the same magnitude in children with ow/ob mothers as in those with hw/uw mothers in adjusted models (core foods: beta coefficient 1·41 (95% CI −1·10, 3·93), P = 0·271, n 687; non-core: foods beta coefficient −1·20 (95% CI −3·63, 1·23), P = 0·332, n 687).
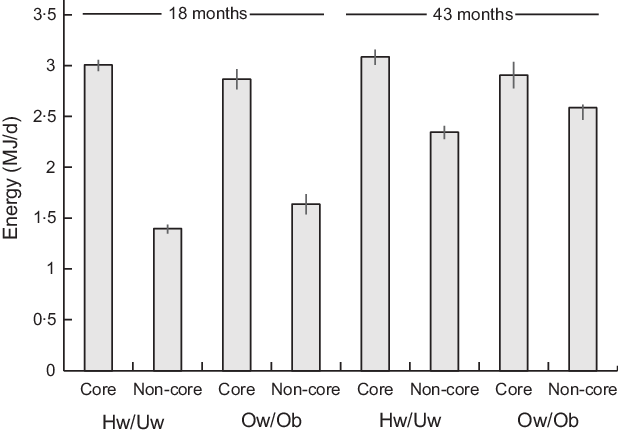
Fig. 1. Mean daily energy intake from core and non-core food groups of the Avon Longitudinal Study of Parents and Children’s Children in Focus (ALSPAC-CiF) children at 18 months and 43 months of age by maternal BMI classification. Values are means with 95% CI. Hw/Uw, healthy weight/underweight; Ow/Ob, overweight/obese. At 18 months: Hw/Uw n 706, Ow/Ob n 202. At 48 months: Hw/Uw n 601, Ow/Ob n 168
Odds of obesity at 43 months
Children with ow/ob mothers had an OR of 1·74 (1·17, 2·58) of being ow/ob at 43 months compared with children with hw/uw mothers in adjusted analyses (P = 0·006).
Discussion
This is the first study of diet in young children to show that maternal ow/ob is associated with poor diet quality in preschool children. Overall, children with ow/ob mothers were found to consume greater amounts of all of the non-core food groups, and lower amounts of some core food groups, than children with hw/uw mothers. Furthermore, children in both groups had a lower quality diet at 43 months than at 18 months with a move towards the consumption of more non-core and less core foods.
Non-core foods are considered excess to requirements for maintaining a healthy childhood diet and are often consumed between meals as snacks(Reference Roberts15). The consumption of such low-quality foods has been associated with overweight in childhood(Reference Nicklas, Yang and Baranowski19). Furthermore, the consumption of non-core food has been increasing amongst children over recent decades, mirroring the increase in childhood obesity prevalence. In this study, children of ow/ob mothers consumed, on average, 10·0% (18 months) and 7·2% (43 months) more energy daily from non-core foods than children with hw/uw mothers. This difference suggests that maternal ow/ob is a risk factor for poor diet quality during early childhood.
A US study comparing past and present food intake amongst children using nationally representative large surveys showed that children have considerably increased their consumption of unhealthy snack foods since the 1970s. In 2006, 27% of children’s daily energy intake was from snacks(Reference Piernas and Popkin20), which is a similar percentage to that found in this study. However, the US sample of children were of an older mean age and were more ethnically diverse than children in this study. The US investigation also found that children aged 2–6 years snack more than any other child age group and increased the amount they snacked the most from 1977 to 2006(Reference Piernas and Popkin20). The results of the present study are the first to show that maternal ow/ob is a risk factor for the consumption of such unhealthy snack foods in young children.
Regular consumption of core food groups is highly important to maintain a healthy diet and provide essential nutrients(Reference Roberts15). In this study, the 18-month-old children with hw/uw mothers consumed higher amounts of fresh fruit than those with ow/ob mothers, although there was no difference in total core food consumption between the groups. In England, children consume considerably less than the recommended amounts of fruits and vegetables(5). The results of this study suggest that having an ow/ob mother is a risk factor for low fruit consumption at 18 months of age. In addition, at 18 months, children with ow/ob mothers consumed less of the yogurt, cheese and milk group than children with hw/uw mothers. An Australian cohort study found that dairy consumption at 18 months was negatively associated BMI at age 8 years(Reference Garden, Marks and Almqvist21), suggesting that dairy consumption at this age may be protective against childhood obesity. The Australian study design was similar to that of this study as both are cohort-based and used 3-d structured food records to collect dietary information. However, a smaller sample size was used in the Australian study (n 364)(Reference Garden, Marks and Almqvist21). In children from the US, there has been a decrease in the consumption of fresh fruit, milk and dairy products from 1976 to 2006, whilst the prevalence of obesity has increased(Reference Piernas and Popkin20).
Less intrinsic sugars (found in foods such as fruit, vegetables and milk) were consumed by the 18-month-old children with ow/ob mothers than children with hw/uw mothers in this study. At the same time, these children consumed greater amounts of free sugars. Free sugars are found in sugar-sweetened beverages, sweetened processed foods, confectionary and chocolate. It has been found that the consumption of sugar-sweetened beverages, in particular, can increase the risk of childhood obesity(Reference Ludwig, Peterson and Gortmaker22). However, in this study, there was no difference in the percentage of consumers of sugar-sweetened beverages between the two groups of children at either age, although the overall percentage increased with age. In some studies, high free sugar consumption has been associated with low intakes of fruits and vegetables(Reference Øverby, Lillegaard and Johansson23,Reference Forshee and Storey24) , thus impacting negatively on core food consumption. A large Swedish cohort study (n 10 762) found a positive association between maternal ow/ob and the early introduction of sweets/pastries and sugar-sweetened drinks in infancy(Reference Brekke, van Odijk and Ludvigsson25), thus supporting the findings of the present study that maternal ow/ob is associated with increased free sugars consumption at a very early age.
The results of this study support other findings that maternal ow/ob significantly increases the odds of childhood obesity(5). It has also provided evidence that ow/ob mothers provide their children with a poorer quality diet than hw/uw mothers. This may therefore be a mediating factor in the association between maternal ow/ob and child ow/ob at 43 months.
This study has confirmed what has been found previously: that there is a large decrease in core food consumption from age 18 to 43 months, whilst non-core food and soft drink consumption increases(Reference Emmett and Jones10). Therefore, diet quality seems to undergo a deterioration from ages 18 to 43 months. Both children with ow/ob mothers and those with hw/uw mothers experienced a deterioration; however, there was limited evidence for difference in the magnitude of this deterioration between the two groups. This is because the diet quality of children with ow/ob mothers was considerably worse than children with hw/uw mothers both at both 18 months and 43 months of age. In addition, maternal ow/ob has its largest detrimental impact on the quality of diet at 18 months rather than 43 months of age.
There are several strengths of this study. (1) The fact that dietary data were derived from detailed food records, collected prospectively with the same children followed at 18 and 43 months allows the detection of changes in diet occurring across childhood. (2) Food record data were collected over a 3-d period and verified by trained staff in parental interviews. The data are therefore extensive, allowing for a comprehensive assessment of diet. (3) The large sample size provides a high power to detect associations. (4) ALSPAC provides a range of socio-economic data and health information relating to these children and mothers that facilitates the consideration of confounders.
There are also limitations for the study. (1) The food records were completed by caregivers who may have mis-recorded their child’s diet. Any systematic differences in the misrepresentation of diet could bias the findings of this study. (2) Weights and energy content of foods were estimated using standard food tables, rather than directly measured. However, alternative approaches such as weighing all food items would have been more time-consuming and challenging for participants, likely resulting in underreporting or alternation from normal diet. In addition, the dietary information may not be entirely representative of long-term diet. However, these dietary collection issues equally affect the food record data collected at 18 and 43 months and therefore should not result in biases in the direct comparisons made between these two ages. (3) BMI measurements of pre-maternal BMI were derived from self-reported weight and height measurements which limit their accuracy. In contrast, child BMI measurements were made in clinics by trained professions, providing robust data for child BMI. (4) Despite generally high retention rates in ALSPAC, attrition is an issue in any longitudinal prospective study. The sample size used in the 43-month analyses was about 15% smaller than that used in the 18-month analyses. In ALSPAC, loss to follow-up tends to be greater amongst mothers and children from lower socio-economic background, which may result in bias in this study. (5) The results may not be generalisable to other parts of the UK or other countries because the ALSPAC study was undertaken in one geographically defined area. Although the cohort was similar to the UK population at recruitment, some differences existed(Reference Fraser, Macdonald-Wallis and Tilling12). These differences are more apparent in CiF subsample used in this study, with children more likely to have a mother with a higher educational attainment than in the general UK population(Reference Cribb, Northstone and Hopkins13). (6) Dietary information was taken from children in this study in the year 1994 (when the children were aged 18 months) and again in 1996 (when the children were aged 43 months). In 1995, the prevalence of childhood obesity in England was 11% for boys and 12% for girls(26). Presently, 15% of children in England are obese(1), and so it is likely that current childhood diet plays an even more important role in causing childhood obesity. However, it has been shown that ALSPAC dietary data are similar to current food and nutrient intakes amongst children(Reference Emmett and Jones10); this supports the generalisability of this study’s findings to the current UK context.
Future research is needed to explore the reasons why maternal ow/ob is a risk factor for poor diet quality during early childhood. The relative contribution of genetic inheritance, learned eating behaviour, food availability and other possible transgenerational risk factors should be investigated. This will help to inform future interventions that aim to improve diet quality in young children.
Conclusion
The findings of this study provide evidence that overweight or obese mothers are more likely to feed their children a poorer quality of diet than hw/uw mothers and this may contribute to the increased odds of them being obese before school age. This indicates that reducing or preventing obesity in mothers may have the secondary benefit of improving the diet quality of their children and therefore helping to tackle childhood obesity. The results show that mothers can have a significant influence over the quality of their child’s diet, which should be considered when developing public health strategies to improve childhood diet quality.
Diet quality deteriorated from ages 18 to 43 months. However, these changes occurred irrespective of maternal BMI class. The findings from the study support the view that children should be encouraged to eat a diet that is high in core foods and low in non-core foods such as processed foods high in fat and sugar. This can be achieved through the promotion of three balanced meals a day, whilst encouraging the provision of ‘healthy’ snack foods and water to drink.
Acknowledgements
Acknowledgements: We are extremely grateful to all the families who took part in this study, the midwives for their help in recruiting them, and the whole ALSPAC team, which includes interviewers, computer and laboratory technicians, clerical workers, research scientists, volunteers, managers, receptionists and nurses. Financial support: The UK Medical Research Council and the Wellcome Trust (grant ref: 102215/2/13/2) and the University of Bristol currently provide core support for ALSPAC. A comprehensive list of grants funding is available on the ALSPAC website (http://www.bristol.ac.uk/alspac/external/documents/grant-acknowledgements.pdf). C.M.T. was supported by a Wellcome Career Re-entry Fellowship (grant ref: 104077/Z/14/Z), by the Elizabeth Blackwell Institute for Health Research, University of Bristol, and the Wellcome Trust Institutional Strategic Support Fund, and by an MRC Career Development Award (grant ref: MR/T010010/1). This publication is the work of the authors who serve as guarantors for the contents of the paper. Conflict of interest: P.H. has no conflicts of interest. C.M.T. and P.M.E. have received research funding from Nestlé Nutrition for unrelated research. Authorship: P.M.E. and C.M.T. conceived the study. P.H. undertook all analyses with consultation with P.M.E. and C.M.T. P.H. wrote the manuscript with critical inputs from P.M.E. and C.M.T. All authors approved the final version of the paper. Ethics of human subject participation: This study was conducted according to the guidelines laid down in the Declaration of Helsinki, and all procedures involving research participants were approved by the ALSPAC Ethics and Law Committee and the Local Research Ethics Committees. Informed consent for the use of data collected via questionnaires and clinics was obtained from participants following the recommendations of the ALSPAC Ethics and Law Committee at the time.
Supplementary material
For supplementary material accompanying this paper visit https://doi.org/10.1017/S1368980021001476


