Article Text

Abstract
OBJECTIVE To derive height and weight growth reference curves for children with homozygous sickle cell disease.
STUDY DESIGN Subjects (n = 315) were participants in a population based, longitudinal cohort study of sickle cell disease in Kingston, Jamaica. Regular measurements of height and weight were made from enrollment into the study at birth up to 22 years of age.
RESULTS Sex specific growth reference curves for height for age and weight for age covering the age range 0–18 years are presented.
CONCLUSION These growth reference curves are suitable for identifying coincidental growth problems in children with homozygous sickle cell disease.
- growth
- reference
- sickle cell disease
Statistics from Altmetric.com
Impaired growth is common in homozygous sickle cell disease. There are early deficiencies in height and weight1 2 and delays in the onset of puberty,3 although the final height of patients with sickle cell disease appears to be normal.4 As a result, conventional growth reference charts might fail to identify coincidental growth disorders in children, such as those caused by growth hormone deficiency or nutrient deficiency. We present height and weight growth reference curves that could help to identify children with a cause of growth delay other than sickle cell disease.
Material and methods
PATIENTS
The patients attended the sickle cell clinic of the University of the West Indies operated by the staff of the MRC laboratories (Jamaica). All participated in a cohort study of sickle cell disease based on the screening of 100 000 consecutive normal deliveries between 1973 and 1981 at the Victoria Jubilee Hospital, Kingston, Jamaica (the main Government maternity hospital in Kingston), which identified 315 babies with homozygous sickle cell disease. The methods for screening and diagnosis have been described by Serjeantet al.5 Apart from five children who failed to be recruited to the study, all surviving children residing in Jamaica have been followed from birth, and were aged between 13 and 22 years at the time of analysis.
GROWTH
Height and weight were measured using a standard protocol at routine three monthly clinic visits and when medical care was required. Height was measured with a Harpenden wall mounted stadiometer accurate to 0.1 cm (CMS Instruments, London, UK), and this was recalibrated weekly. Weight was measured in light clothing and without shoes on a beam balance (Detecto, Brooklyn, New York, USA). Staff were trained in the use of the equipment and monitored at regular intervals. Measurements that, in the opinion of the research paediatrician conducting the clinic, appeared inconsistent with previous values were checked on independent equipment. Over the study period, measurements were made by a number of different observers.
Editing of height and weight data was performed by plotting height and weight against age for each individual, to identify outlying points, which were then checked and edited where necessary. Five patients with conditions that might have effected growth were excluded from the study, leaving 306 individuals contributing measurements to the study. Heights and weights were excluded after diagnosis of systemic lupus erythmatosus (one patient), stroke (21 patients), congenital heart disease (one patient), and nephrotic syndrome (one patient); and after commencement of testosterone treatment for retarded puberty (three patients). Weight measurements during pregnancy (13 events) and when wearing plaster of Paris casts for avascular necrosis of the femoral head (five events) were also excluded.
STATISTICAL METHODS
For each individual, height and weight measurements were selected at six month intervals (± 3 months) aligned with birthdays. Tables 1and 2 show the numbers of patients with height and weight data at each age, respectively. The falling numbers before age 13 years reflected losses from deaths and emigration, whereas after the age of 13 they reflected individuals not yet reaching more advanced ages. Data after the age of 19 years was too sparse to include in the analyses. The average follow up over all ages was 90% of available subjects.
Summary data on height (cm) for male and female patients with homozygous sickle cell disease
Summary data (centiles) on weight (kg) for male and female patients with homozygous sickle cell disease
Summary measures of the height and weight distributions were calculated on three month intervals centred on birthdays (tables 1 and 2). This might result in variability in height and weight being overestimated because one would expect to see smaller heights at the beginning of the interval and larger ones at the end. Furthermore, average heights and weights depend on the average age of individuals within the interval, and a tendency for measurements to be made before or after target birthdays might result in biased estimates. To compensate for this, height and weight were regressed on age within each interval, and the equations of the resulting regression lines used to remove these sources of potential error from the calculation of the summary statistics. Height appeared to be roughly normally distributed at all ages and the distributions have been summarised by the means and standard deviations. The distributions for weight looked skewed and have been summarised using 25th, 50th, and 75th centiles.
The references curves for height and weight were derived using the LMS method described by Cole and Green.6 The distributions of height and weight at each age were summarised by three parameters, namely: L the Box-Cox power transformation needed to remove skewness from the distribution, M the median, and S the coefficient of variation.
The method of maximum penalised likelihood was then used to provide smoothed estimates of these parameters. A two stage smoothing process was used that is more suitable for the complex shape of the curves seen here.7 The degree of smoothing needs to achieve a balance between faithfulness to the data and smoothness, and is determined by the “equivalent degrees of freedom” of each curve. The choice of appropriate values was guided by the use of a likelihood ratio significance test.
Values from the smoothed L, M, and S curves were then combined to produce centile curves that are themselves smoothed. The validity of the curves was checked by calculating whether they divided the raw height and weight data into the correct proportions; for all ages combined and separately for the age groups 0–5.99 years, 6–11.99 years, and 12–17.99 years.
The precision in estimating each of the centile curves was assessed by calculating approximate 95% confidence intervals (CI) using a simulation procedure with 25 sets of simulated data.7 The LMS method with smoothing by maximum penalised likelihood was implemented using the Windows 95 based LMS software (TJ Cole, personal communication, 1999). Curves representing the 3rd, 10th, 25th, 50th, 75th, 90th, and 97th centiles between 0.5 and 18 years old are given, and for clarity only the 3rd, 50th, and 97th centiles between 0 and 0.49 years old. Data between 18.0 and 19 years old have been included in the calculations (where the data have been allowed to influence the shape of the reference curves) but not in the figures (because of a lack of precision in the estimates as a result of the decreasing sample size at these ages).
The growth reference standards derived in this study are compared with those derived by the National Center for Health Statistics (NCHS).8 Standard deviation scores based on the NCHS standards were calculated using Epi Info.9
Results
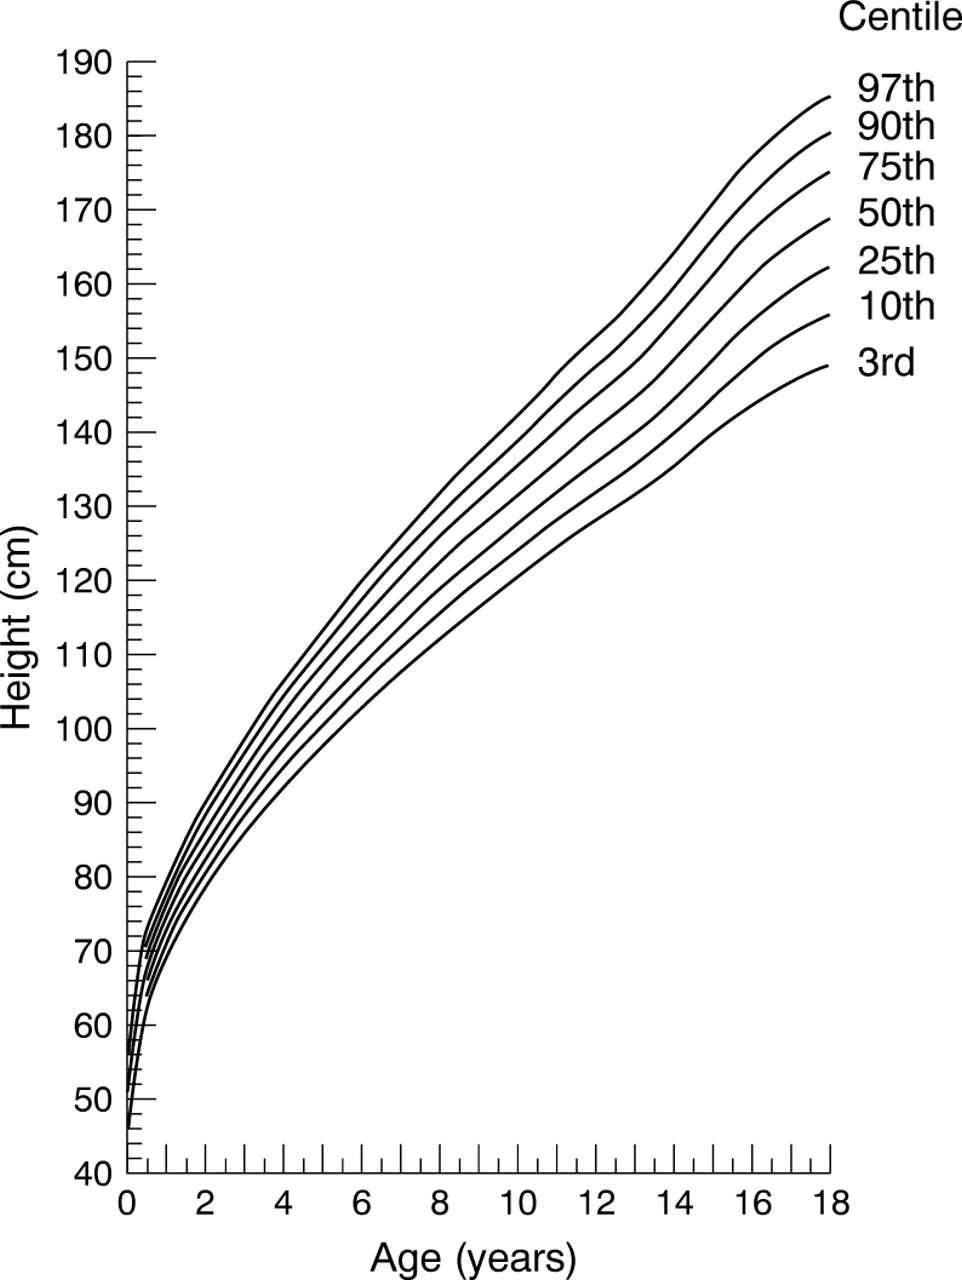
Summary statistics by age and sex are tabulated for height (table1) and weight (table 2). Figure 1 shows the height reference curve for male patients and fig 2 shows the reference curve for female patients. Figure 3 shows the weight reference curve for male patients and fig 4shows the reference curve for female patients. Overall, and within each of the three age groupings, the centile curves divide the sample into approximately the correct proportions (table 3). Table 4 shows the widths of approximate 95% confidence intervals for each curve.
Copies of these growth charts are available from Harlow Printing, Maxwell Street, South Shields, Tyne and Wear NE33 4PU, UK.

Height reference chart for boys with homozygous sickle cell disease.

Height reference chart for girls with homozygous sickle cell disease.

Weight reference chart for boys with homozygous sickle cell disease.

Weight reference chart for girls with homozygous sickle cell disease.
Goodness of fit assessed by percentage of sample falling within smoothed centiles
Width of approximate 95% confidence intervals for smoothed height (cm) and weight (kg) centiles
Table 5 shows the 3rd, 10th, 50th, 90th, and 97th centiles of height and weight at selected ages, expressed as standard deviation scores (Z-scores) using the NCHS growth reference standards. At birth, height and weight in both boys and girls were similar to NCHS standards, but fell away thereafter. By age 18 years, female patients had caught up with NCHS standards, but male patients, many of whom were still growing, had not yet caught up.
Height for age and weight for age centile values expressed as Z scores using NCHS standards
Discussion
Additional growth problems in children with homozygous sickle cell disease can be difficult to detect because their growth is often already retarded compared with children with a normal haemoglobin genotype. The reference curves presented here allow longitudinal assessment of growth in patients, and should assist careful monitoring of growth, and early detection of growth problems. Suboptimal nutrition, chronic hypersplenism, and endocrine abnormalities may retard growth in these children, and disease specific, longitudinally derived reference curves should assist the clinician in their early detection.
The need for disease specific reference curves is illustrated by comparing our reference standards to the USA reference standards for normal children.8 9 At birth, mean lengths and weights in boys and girls with homozygous sickle cell disease were close to USA standards. The growth of children with homozygous sickle cell disease then fell away, exhibiting maximum lag at around 10–15 years of age. Thereafter, boys and girls began to catch up. In girls, catch up started earlier, the 50th centile curve for height had plateaued by age 18 years, and the Z-score for mean height at age 18 years in this group (mean, 0.22; 95% CI, −0.09 to 0.53, assuming a standard deviation of 1), was consistent with USA standards. Furthermore, puberty was delayed by an average of 2.0 years in boys and girls with homozygous sickle cell disease compared with normal USA boys and girls.3 10Therefore, it is not appropriate to use USA standards in normal children to identify impaired growth in children with sickle cell disease.
Detailed growth reference curves have not been available previously for children with homozygous sickle cell disease, who are known to manifest impaired growth compared with normal children in a variety of settings,1 11-13 delay in adolescent growth,3 and similar mean height (but not weight) as adults.3 4 14 During puberty, linear growth within individuals is often poorly represented by simple growth reference curves, and centile changes within an individual can be misinterpreted.15 Unfortunately, there were not enough individuals with data on growth throughout puberty to allow precise estimation of centile curves that take into account variability in the timing of the pubertal growth spurt.
Because the mean height for age for both sexes in our study matched closely the 50th centile height for age curve produced by Plattet al,14 our reference curves are likely to be applicable outside of the Jamaican setting. In contrast, mean weight in our study was similar to theirs at birth and then fell away before catching up at around 15 years of age in girls and 18 years in boys.
The precision of the estimates of centile values of height and weight (as summarised by the approximate widths of the 95% confidence intervals) depends on the variability of height and weight, both of which increase with age, and the number of subjects with available data. Furthermore, outer centiles will be estimated with less precision than the 50th centile (although this is not always evident from the width of the confidence intervals because of the approximation). Sample size is reasonably large (∼ 100) up until about 14 years of age, and then falls steeply thereafter to around 40 at age 18 years, resulting in reduced precision at later ages. Furthermore, at many ages, including the 17–18 age band, sample size in our study exceeds that used in the British standards produced by Tanner et al.16
We suggest that the growth reference curves presented here are a tool useful in the detection of superimposed growth problems in sickle cell disease, and more appropriate than the existing USA based reference curves for normal children. Comparison with other studies suggests that the reference curves will be applicable outside of Jamaica.
Acknowledgments
The authors thank Dr T Cole for giving them access to the LMS software used in the development of these reference curves.