Article Text

Abstract
Objective: To produce representative cross-sectional blood pressure reference centiles for children and young people living in Great Britain.
Design: Analysis of blood pressure data from seven nationally representative surveys: Health Surveys for England 1995–8, Scottish Health Surveys 1995 and 1998, and National Diet & Nutrition Survey 1997.
Methods: Blood pressure was measured using the Dinamap 8100 with the same protocol throughout. Weight and height were also measured. Data for 11 364 males and 11 537 females aged 4–23 years were included in the analysis, after excluding 0.3% missing or outlying data. Centiles were derived for systolic, diastolic, mean arterial and pulse pressure using the latent moderated structural (LMS) equations method.
Results: Blood pressure in the two sexes was similar in childhood, rising progressively with age and more rapidly during puberty. Systolic pressure rose faster and was appreciably higher in adult men than in adult women. After adjustment for age, blood pressure was related more to weight than height, the effect being stronger for systolic blood pressure. Pulse pressure peaked at 18 years in males and 16 years in females.
Conclusions: These centiles increase our knowledge of blood pressure norms in contemporary British children and young people. High blood pressure for age should be defined as blood pressure above the 98th centile, and high-normal blood pressure for age as blood pressure between the 91st and 98th centiles. The centiles identify children and young people with increased blood pressure, and will be of benefit to both clinical practice and research.
- SDS, standard deviation score
This is an open-access article distributed under the terms of the Creative Commons Attribution License, which permits unrestricted use, distribution, and reproduction in any medium, provided the original work is properly cited.
Statistics from Altmetric.com
There is no satisfactory definition of hypertension in children.1 As a result, blood pressure is often not measured in paediatric clinical practice, and understanding the clinical significance of blood pressure readings in children is hampered by the lack of satisfactory reference data with which to interpret them.
Reference blood pressure centiles should therefore improve the understanding of blood pressure variation in childhood. In Britain and worldwide, there have been many studies of childhood blood pressure, but all are of limited use in Great Britain owing to the use of non-representative populations, limited age ranges and mixed methodologies for blood pressure measurement. Accordingly, we have developed representative cross-sectional blood pressure references for children and young people living in Great Britain.
METHODS
Blood pressure data from seven national health and social surveys carried out between 1995 and 1998 were obtained from the UK Data Archive (http://www.data-archive.ac.uk/)(table 1⇓). The data were originally collected on behalf of the Departments of Health and the Ministry of Agriculture Fisheries and Food, by the Joint Health Surveys Unit of Social and Community Planning Research and University College London, London, UK and the Social Survey Division of the Office for National Statistics and Medical Research Council, Human Nutrition Research, Cambridge, UK.
Demographic characteristics of 22 974 participants aged 4–23.9 years from seven national health and social surveys
The survey samples were obtained by stratified multistage sampling techniques to ensure that there was a proportional representation of the population at large by sex, age, geographical region and social class.2 In brief, the demographic characteristics of a geographical area are known from census and other data. Using this information, a representative sample of individuals from the target age groups for each survey was obtained. Households in geographical areas selected by postcode were contacted and asked to fill in a questionnaire to identify eligible young people. A subset of this initial sample was then contacted by trained interviewers. The demographic characteristics of those agreeing to take part were determined and further targeted sampling undertaken to ensure the study sample remained representative. More information may be found in the published surveys.
Ethical approval was obtained from all areas in which the surveys were carried out. Participation was subject to informed consent. Data for the present analysis were excluded for participants who had eaten, consumed alcohol or smoked in the 30 min before being measured, and for those on antihypertensive drugs.
All seven surveys used the Dinamap 8100 (Critikon, Tampa, Florida, USA) with the same protocol to measure blood pressure. The use of an automatic oscillometric method was necessary for practicality, accuracy and reproducibility.3,4 Briefly, the blood pressure cuff was applied to the right arm. The lower margin of the cuff was placed about 2 cm above the elbow crease, with the arrow marked on the cuff placed over the brachial artery. The cuff was wrapped to a tightness allowing two fingers to be inserted under the top and bottom of the cuff. Four cuff sizes were available, the appropriate cuff size being determined by measurement of the mid-upper arm circumference (child cuff 10–19 cm, small adult cuff 17–25 cm, adult cuff 23–33 cm, large adult cuff 31–40 cm). The participants were comfortably seated, with their feet flat to the floor. Measurements of systolic, mean arterial and diastolic pressure were obtained after a 10–15 min rest period in triplicate, at minute intervals. The first reading was discarded and the mean of the second and third readings was used for analysis, as the first reading of a series of blood pressure measurements is typically higher with oscillometric devices.4,5 Pulse pressure was calculated by subtracting diastolic from systolic pressure.
For 73 (0.3%) participants, the blood pressure data were found to be either outliers or inconsistent with age, lying more than five SD from the median for age and sex. Hence blood pressure data for 22 901 participants, 11 364 male and 11 537 female, aged 4–23.9 years were analysed.
Sex-specific smoothed centiles were derived using the latent moderated structural equations (LMS) method6 for age and sex. The LMS method summarises the age-changing frequency distribution of blood pressure in terms of three curves: the L curve defines the skewness, the M curve the median and the S curve the coefficient of variation as functions of age. Centile charts were drawn with centiles spaced two-thirds of an SD score (SDS) apart, ranging from the 0.4th centile (−2.67 SDS) through to the 99.6th centile (+2.67 SDS), consistent with other anthropometric charts in current use in the UK.7
The relationship of systolic and diastolic blood pressure, weight and height was investigated through the multiple regression of blood pressure on weight and height, after adjusting the three variables for age and sex by converting them to SDS. The British 1990 reference8 was used for height and weight, and the internal reference for blood pressure. For measuring weight and height in subjects age ⩾23 years was taken as 22.99 (the upper limit of the British reference). Sex effects were tested for in the regression by including sex and its interactions with height and weight.
RESULTS
Table 2⇓ summarises the data for 22 901 participants with both systolic and diastolic blood pressure. Mean arterial pressure, height and weight were missing for 8%, 1% and 2% of participants, respectively. By year of age the sample consisted of 114 participants aged 4 years, 1181–1581 per year between 5 and 16 years, and 715–950 per year between 17 and 23 years. Height was very similar to the British 1990 reference (mean SDS 0.0), while weight and body mass index (weight (kg)/height2 (m2)) were slightly increased (mean SDS 0.3–0.4).
Summary statistics for 22 901 participants with valid data
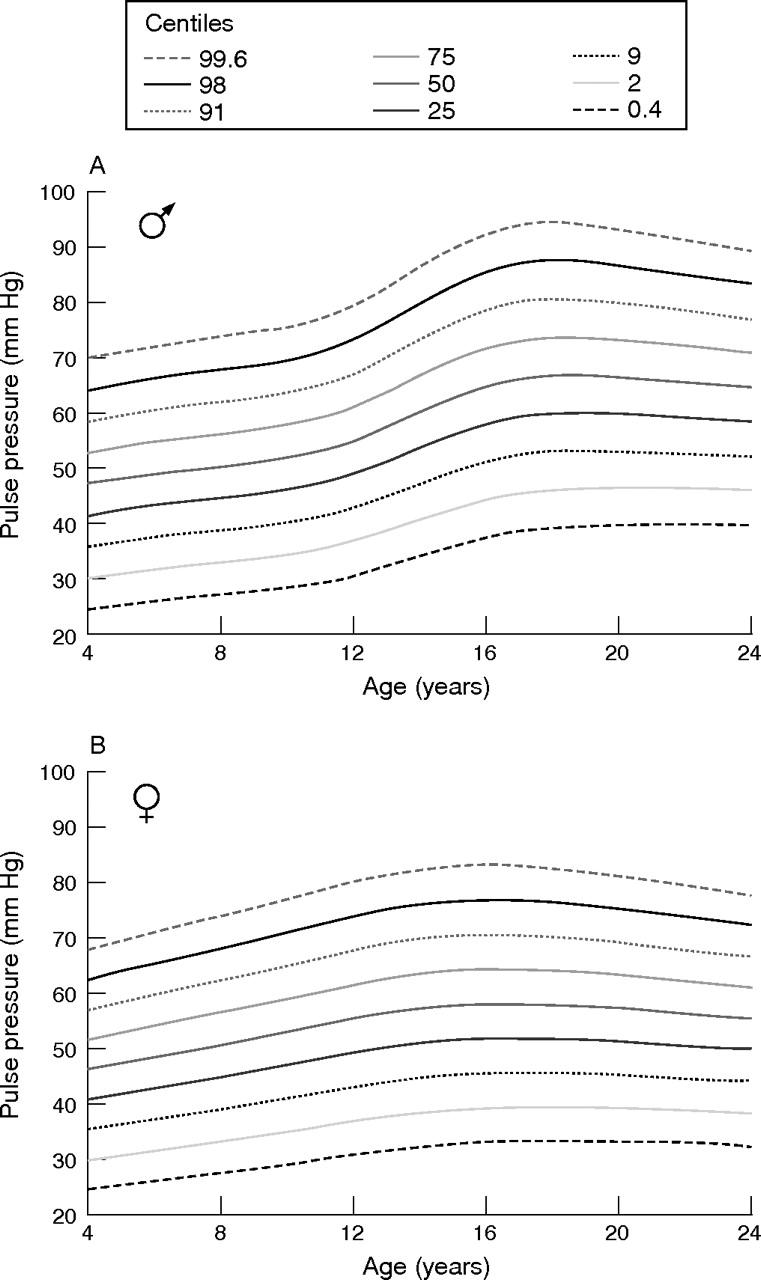
The data were used to construct blood pressure centile charts for systolic, diastolic, mean arterial and pulse pressure (figs 1⇓–4⇓). Blood pressure in the two sexes was similar before puberty, but the pubertal rise was more marked in boys. Pulse pressure peaked at 18 years in male participants and at 16 years in female participants, corresponding to the end of puberty.

Systolic blood pressure centiles in male (A) and female participants (B). The centiles are spaced two-thirds of a standard deviation score apart. Systolic pressure rises progressively with age, but rises more steeply in puberty, particularly in boys.
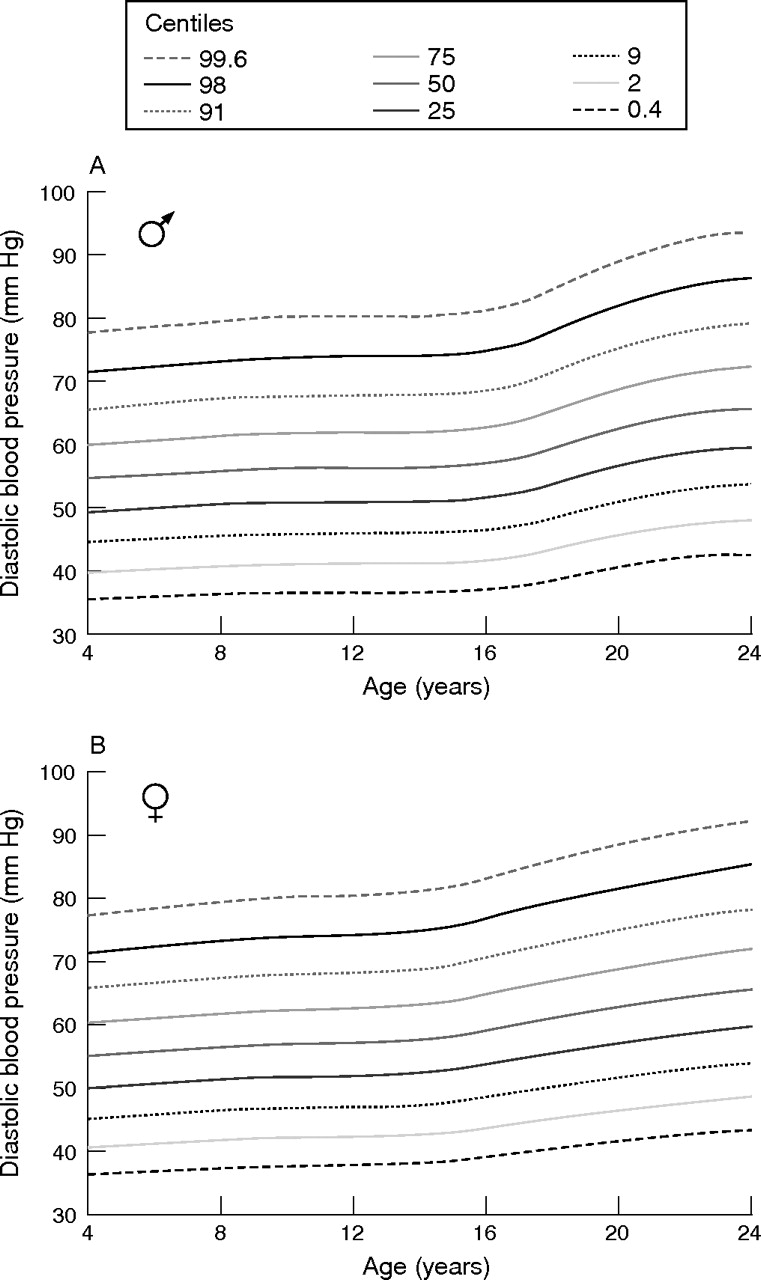
Diastolic blood pressure centiles in male (A) and female participants (B). The centiles are spaced two-thirds of a standard deviation score apart. Diastolic pressure rises slowly in childhood, but as with systolic pressure, rises more steeply in puberty.

Mean arterial pressure centiles in male (A) and female participants (B). The centiles are spaced two-thirds of a standard deviation score apart. Mean arterial pressure rises progressively with age.

Pulse pressure centiles in male (A) and female participants (B). The centiles are spaced two-thirds of a standard deviation score apart. Pulse pressure rises progressively until the end of puberty and then falls again.
Table 3⇓ summarises the multiple regression of blood pressure on weight and height, each adjusted for age and sex by converting to SDS. This adjustment allowed the data for both sexes and all ages to be combined. Results are also given by sex, although they do not differ significantly; hence the combined results are valid. Weight had a large and positive effect on blood pressure (p<0.001), whereas height had a smaller negative effect (0.005<p<0.001). A 1 SD increase in weight was associated with a 0.3 SD increase in systolic pressure and a 0.08 SD increase in diastolic pressure, whereas a 1 SD increase in height was associated with a 0.03 SD reduction in both systolic and diastolic pressure. Thus, on average, for any given weight, a taller (and hence thinner) individual had lower blood pressure. Analysing the data in separate age groups showed the associations in late puberty to be stronger than before or after.
Relationship of systolic and diastolic blood pressure with weight and height by sex (all variables expressed as standard deviation score)
These results suggest that body size (ie, weight) and obesity (weight adjusted for height) both play a role in raising blood pressure, particularly systolic blood pressure, 8% of the variation of which was explained by weight and height. The effect on diastolic blood pressure (0.5% of variance explained) was much smaller.
Using the British Hypertension Society cut-offs for hypertension,9 23% of men and 6% of women exceeded the systolic cut-off, and 1.0% of men and 0.8% of women exceeded the diastolic cut-off by age 24 years.
DISCUSSION
The blood pressure centiles presented here are based on data collected using a consistent and rigorous method in representative samples of nearly 23 000 children and young people living in Great Britain. As such, we believe they are the most accurate characterisation of normal blood pressure in any country to date.
It is well recognised that children’s blood pressure tends to “track” over time.10–,14 Moreover, high blood pressure in children is associated with the development of atherosclerosis,15–,19 especially in those with additional risk factors, notably obesity.16–,20 The charts will aid the timely recognition and monitoring of individuals with high blood pressure and hypertension, and facilitate the detection of children with secondary hypertension, consequent on renal, endocrine or other disease.1 Blood pressure monitoring is also important in children at risk of hypertension and/or vascular disease, such as those with obesity, diabetes, renal disease, or those receiving steroids or stimulant drugs and where a family history of hypertension is present.
We have used a standard nine-centile format consistent with other charts in use in the UK.7 The charts show a progressive rise in systolic and diastolic pressure with increasing age, the rise being more marked in males during puberty. This is consistent with an effect of body size (indicated by weight) and obesity (weight adjusted for height) on blood pressure, the effect being stronger for systolic blood pressure. Thus males, who gain more weight at puberty than females, have significantly higher blood pressures, with almost a quarter satisfying the British Hypertension Society definition of hypertension,9 defined as systolic pressure >140 mm Hg and/or diastolic pressure>90 mm Hg, by the age of 24 years. The high systolic pressures in older teenagers and young adults, particularly men, are of special concern. However, blood pressure measurements on a single occasion are insufficient for the determination of high or high-normal blood pressure for age,21,22 in the absence of evidence of a pathological cause or end organ damage, especially in children, who are more prone to “white coat” hypertension.23 Repeated measurements typically show that the majority of children with increased blood pressure on a single occasion subsequently have normal blood pressure.24
Pulse pressure25,26 and mean arterial pressure27 have been found to be significant determinants of morbidity and mortality in adults. The significance of these measures in children is unknown, but pulse pressure may be an indicator of early arterial disease, as has been found in young adults with type 1 diabetes.27 Of note, we found that pulse pressure peaks at the end of puberty in both sexes, before falling in young adult life (fig 4⇑) in contrast with systolic, diastolic and mean arterial pressures, which rise progressively with age (figs 1⇑–3⇑). A knowledge of normal ranges for pulse pressure and mean arterial pressure should aid research in this area.
The use of oscillometric blood pressure measurements was dictated by the nature of the health and social surveys, which required a reliable, reproducible and accurate method for determining blood pressure, using multiple observers.3,4 The Dinamap 8100 was subject to a rigorous calibration study3 to ensure its validity (although the calibration study did not include participants aged <16 years). However, the Dinamap monitor has been compared with direct radial artery pressure and central aortic pressure measurements in infants and children and was found to be superior to the auscultatory method.28,29 Moreover, particularly in young children, the conventional mercury sphygmomanometer can be difficult to use,4,20 with the Korotkoff sounds hard to distinguish, so, increasingly, automated oscillometric devices are being used in clinical practice.30
O’Brien et al,31 using the British Hypertension Society protocol, graded the Dinamap 8100 B for systolic blood pressure and D for diastolic blood pressure compared with the conventional mercury sphygmomanometer in adults.32 Paediatric studies have generally found significant differences, particularly between diastolic pressure assessed by fourth-phase Korotkoff sounds.33–,35 However, an Australian study of prepubertal children with type 1 diabetes using the British Hypertension Society protocol graded the Dinamap B for both systolic and diastolic pressure.36
The Dinamap 8100 and other oscillometric devices produce results that differ in comparison with the mercury sphygmomanometer. These differences have been attributed to inaccuracies37 but simply reflect the fact that different methods yield different results.1,38 However, in view of these differences, blood pressure results recorded with the mercury sphygmomanometer should be referenced to these centiles with caution.
What is already known on this topic
-
Blood pressure rises through childhood and childhood blood pressure strongly predicts adult blood pressure.
-
This rise in blood pressure is substantially determined by weight.
-
As with growth, blood pressure is an important parameter of child health.
-
Furthermore, atherosclerosis and hypertension may have their origins in childhood, particularly in those with additional risk factors—for example, obesity, renal disease or diabetes.
What this study adds
-
These blood pressure centiles compiled from nationally representative data are the most comprehensive attempt to characterise normal blood pressure in childhood in Great Britain.
-
The centiles complement existing charts for height, weight and body mass index and other parameters in evaluating the health of children.
-
This information will contribute to a better understanding of blood pressure in childhood and aid further research.
The definition of hypertension in children is problematic. Use of the British Hypertension Society cut-offs in adults is justified by adverse health outcomes in association with hypertension.9 However, no single cut-off can define hypertension in children owing to the normal rise in blood pressure with age, and the paucity of evidence about what constitutes hypertension in children.1 Consequently, we suggest that, in children, those above the 98th centile on repeated occasions are stated to have high blood pressure for age, whereas those lying between the 91st and 98th centiles are stated to have high-normal blood pressure for age. These cut-offs are similar to recommendations made in the Taskforce Report on High Blood Pressure in Children and Adolescents in the USA.39 Our centile-based definitions predict a prevalence of 2.3% for high blood pressure (>2 SDS) and 6.9% for high-normal blood pressure (>1.33 SDS). These centiles should facilitate ongoing research into the importance of high or high-normal blood pressure in children, and serve as a basis for defining hypertension in childhood.
The strong association between high blood pressure and weight/obesity that we and others have found40,41 is of particular concern given the well documented rise in childhood obesity.42 Childhood obesity, and its health consequences—including hypertension, metabolic syndrome and type 2 diabetes—present a major challenge for the coming years and demand vigilance and concerted action from all healthcare professionals to mitigate the adverse health consequences for children and young people.
Acknowledgments
We thank Dr Graham Derrick, Consultant Paediatric Cardiologist, Great Ormond Street Hospital for Children NHS Trust, and Dr Carlo Acerini, University Lecturer in Paediatrics, Cambridge University, for their helpful comments.
REFERENCES
Supplementary materials
Files in this Data Supplement:
Footnotes
-
Published Online First 11 August 2006
-
Funding: TJC is funded by the Medical Research Council.
Research at the UCL Institute of Child Health and Great Ormond Street Hospital for Children NHS Trust benefits from R&D funding received from the NHS Executive.
-
Competing interests: Subsequent to the presentation of data at the Spring Meeting in April 2003, blood pressure centile charts using these data were published commercially.
-
Previous publication: Some of this work was presented as an oral presentation at the Royal College of Paediatrics & Child Health Spring Meeting, April 2003: G203. Blood pressure centiles for children and young people aged 4–24 years in Great Britain. Arch Dis Child 2003; 88:A66.
Contributors: all authors contributed to the design, analysis and writing up of the paper. LVJ is guarantor.
Linked Articles
- Précis
- Atoms
- Perspectives
- CORRECTION