Article Text

Abstract
Background In 2014, the Joint United Nations Programme on HIV and AIDS (UNAIDS) and partners set the ‘90-90-90 targets’; aiming to diagnose 90% of all HIV positive people, provide antiretroviral therapy (ART) for 90% of those diagnosed and achieve viral suppression for 90% of those treated, by 2020. This results in 81% of all HIV positive people on treatment and 73% of all HIV positive people achieving viral suppression. We aimed to analyse how effective national HIV treatment programmes are at meeting these targets, using HIV care continuums or cascades.
Methods We searched for HIV treatment cascades for 196 countries in published papers, conference presentations, UNAIDS databases and national reports. Cascades were constructed using reliable, generalisable, recent data from national, cross-sectional and longitudinal study cohorts. Data were collected for four stages; total HIV positive people, diagnosed, on treatment and virally suppressed. The cascades were categorised as complete (four stages) or partial (3 stages), and analysed for ‘break points’ defined as a drop >10% in coverage between consecutive 90-90-90 targets.
Results 69 country cascades were analysed (32 complete, 37 partial). Diagnosis (target one—90%) ranged from 87% (the Netherlands) to 11% (Yemen). Treatment coverage (target two—81% on ART) ranged from 71% (Switzerland) to 3% (Afghanistan). Viral suppression (target three—73% virally suppressed) was between 68% (Switzerland) and 7% (China).
Conclusions No country analysed met the 90-90-90 targets. Diagnosis was the greatest break point globally, but the most frequent key break point for individual countries was providing ART to those diagnosed. Large disparities were identified between countries. Without commitment to standardised reporting methodologies, international comparisons are complex.
This is an Open Access article distributed in accordance with the Creative Commons Attribution Non Commercial (CC BY-NC 4.0) license, which permits others to distribute, remix, adapt, build upon this work non-commercially, and license their derivative works on different terms, provided the original work is properly cited and the use is non-commercial. See: http://creativecommons.org/licenses/by-nc/4.0/
Statistics from Altmetric.com
Key questions
What is already known about this topic?
Cascades of HIV care have been used for a few years by national treatment programmes to depict the effectiveness of coverage of care. For most countries, where cascade reports have been published annually, progress has been seen.
The Joint United Nations Programme on HIV and AIDS (UNAIDS) calls for countries to improve diagnosis of HIV, access to antiretroviral therapy (ART) and achievement of viral suppression with the 90-90-90 targets.
What are the new findings?
Cascade reporting methods are relatively heterogeneous; however, with the new UNAIDS 90-90-90 targets, WHO treatment guidelines and reporting indicator requirements, more and more countries should begin to report cascades more uniformly.
Large disparities exist between countries. While some are close to meeting the UNAIDS 2020 goals already, others will require a great deal of progress over the coming years.
Recommendations for policy
Countries should be clear and precise when reporting the stages of a cascade, so that progress can be monitored as we move towards 2020 and resources can be targeted towards the stages in the cascade, where the most attrition occurs.
This research was constructed using the most recent publicly available data as of September 2015. We would warmly welcome any more recent or more reliable national-level data, from all countries not yet included, or updates to the 69 included countries, for a follow-up to this project.
Background
In 2014, the Joint United Nations Programme on HIV and AIDS (UNAIDS) and partners launched three ambitious 90-90-90 targets for 2020 as a commitment to improve access to antiretroviral therapy (ART)1 as a life-saving treatment,1 ,2 a transmission prevention measure3 and a human right.4 These three targets are as follows: target one is successfully diagnosing 90% of all HIV positive people. Target two involves delivering antiretroviral therapy (ART) to 90% of those diagnosed, and finally, target three involves achieving viral suppression for 90% of those on treatment. This final goal of projected coverage, allowing for serial 10% losses at each subsequent step, results in 73% of all HIV positive individuals achieving viral suppression.1
Effective and safe delivery of medical care for HIV requires a sequence of diagnostic tests, assessments, treatment delivery, support and monitoring. This care continuum has been termed the ‘HIV treatment cascade’. The cascade can be used to illustrate and measure the effectiveness of a country's ART programme.5 Cascades report various stages, including total HIV positive people, diagnosed, linked to care, retained in care, treatment eligibility, on ART, adherence to treatment, retention post ART initiation and viral suppression. Following the results of, Strategic Timing of Antiretroviral Treatment (START),2 TEMPRANO6 and recent WHO guidelines7 shifting towards ‘treating all diagnosed positive’, CD4 eligibility should no longer be relevant.
Several key factors affect coverage of the various steps of HIV cascades; individual, societal and structural.8 Initially, community education and uptake of testing is required at a population level, widespread among generalised epidemics and targeted testing within focused epidemics. Second, linkage to care, retention in care and support following diagnosis is required for all HIV positive individuals prior to starting treatment. Sustainable procurement and provision of ART is imperative. Finally, individual understanding and motivation is required to maintain treatment adherence9 and post ART retention combined with HIV viral load testing for monitoring.
Until recently, there has been an absence of standardised reporting methodologies, stage definitions and agreed structures to unify cascade data, making comparison of HIV treatment cascades difficult.10 UNAIDS has recently issued 10 national-level indicators for HIV reporting to unify the reporting process.7 ,11 This study aims to provide national-level cascade data using currently available figures so that progress can be monitored on the way to 2020, as better reporting systems are implemented.
Methods
Global cascade construction method
UNAIDS11 estimates that in 2014 there were 36.9 million people living with HIV. Applying the 90-90-90 percentages to this figure shows how many people should be in each cascade stage. The gaps in each stage were estimated using published figures for the total number of people diagnosed and on ART globally, in 2014.11 A systematic review on viral suppression rates in low and middle-income countries was used to estimate the total number of individuals with a supressed viral load at 12 months on intention to treat analysis.12
HIV treatment cascade selection and inclusion criteria
We searched OvidSP, PubMed, UNAIDS databases and national reports for HIV treatment cascades published up to August 2015. Search terms were ‘HIV’ or ‘AIDS’ and ‘treatment cascade’ or ‘continuum of care’ separately combined with 196 individual country names (flow diagram online supplementary appendix figure 1).
Supplementary appendix figure 1
In order to evaluate the 90-90-90 targets, data were extracted for four main stages; 1—total number of HIV positive people; 2—number of people diagnosed; 3—number of people on treatment; 4—number of people achieving viral suppression. Viral suppression was often listed as ‘undetectable HIV RNA’, ranging from <1000 copies HIV RNA/mL to <40 copies HIV RNA/mL depending on test sensitivity, but sometimes the cut-off used was not reported (NA).
Complete cascades were defined as those which reported numbers and percentages for all four of these stages. Partial cascades reported numbers or percentages for three of these stages. We excluded cascades which reported fewer stages and excluded data from smaller cohorts (eg, regional data from British Columbia)13 or non-generalisable groups (eg, research studies)14 ,15 or cascades exclusively from high-risk groups (eg, female sex workers16 (FSW) or men who have sex with men16 ,17 (MSM)).
Data sets were generated based on either longitudinal (individual-level data followed within a cohort study) or cross-sectional studies (national surveillance studies). Some cascades were constructed from a combination of representative longitudinal studies, which were projected onto cross-sectional sources (combination method).
National cascade stage definitions
Data for many countries were extracted from UN General Assembly Special Session (UNGASS) country-level reports, submitted to UNAIDS using the Global AIDS Response Progress Reports tool (GARPR).17 A short overview of the data collection methods reported for each of the four main stages are outlined below:
Total HIV positive population. Estimates of the total HIV epidemic size were generally calculated using Spectrum17 or back calculated using other epidemiological models based on data from national HIV testing programmes or smaller anonymous unlinked seroprevalence surveys.18–21
Number diagnosed as HIV positive. The number of people diagnosed was defined using country reports of the cumulative number of people tested and found HIV-1 positive.16 Diagnosis was made using HIV antibody tests minus false positives, those recorded to have died or permanently migrated17 (eg, the Netherlands22). Testing procedures differed between countries where some require two or more HIV positive tests to confirm diagnosis (eg, Uganda17).
Despite linkage and retention in care being extremely important components of the care continuum for country-level monitoring and individual patients, these stages were not analysed for break points because there are not corresponding targets within the 90-90-90 goals (available in the online supplementary appendix figures 2.01–2.69). Definitions of linkage and retention are highly heterogeneous between cascades, making comparison across countries difficult.10 Some countries report pre ART eligibility23 based on CD4 count, but as national guidelines vary greatly between countries and WHO guidelines shift towards treatment irrespective of CD4 count,7 this stage was excluded.
Number on ART. ART coverage was generally calculated using records of drugs dispensed from healthcare facilities, pharmacy records and governmental drug purchases (adjusted for treatment change, pre-exposure and postexposure prophylaxis use). Our analysis did not differentiate between different ART regimens prescribed, as most countries did not break this down. Initiation on ART constituted this category despite many countries also reporting 6-month and 12-month post ART retention. Countries without a centralised national dispensary or with many private or non-government organisation (NGO) treatment providers may underestimate the number of people on ART unless this dispensary data are collated. The USA, for example, attempts to overcome this problem collating data in the medical monitoring project and centre for disease control.17
Viral suppression. The threshold for undetectable HIV RNA ranged from <40 copies/mL (Rwanda,24 Tanzania17) to <1000 copies/mL (Russia23). We included data where at least one viral load measure was recorded <1000 following treatment. Intention to treat analysis at 12 months was preferred if multiple figures were reported.12 ,25 For countries where viral load measurements are not routine, estimates were extrapolated from smaller generalisable cohorts (eg, Uganda17). Adherence, high CD4 counts (eg, Italy26) or post ART retention were not accepted as surrogate markers for viral suppression. Viral suppression was estimated for 10 African countries (Nigeria, Zambia, Zimbabwe, Senegal, Cote d'Ivoire, Burkina Faso, Mozambique, Cameroon, Tanzania and Botswana) where national reports11 did not indicate viral suppression rates. We applied the percentages from a systematic review25 (also used by UNAIDS to estimate the average viral suppression rates for sub-Saharan Africa11) to these individual countries following post ART retention at 12 months.
Break point definition
The 90-90-90 targets permit a drop by 10% between each of the four stages of the cascade11 (see table 1). We defined a reduction in coverage by >10% between any of the three 90-90-90 targets as a ‘break point’ in the cascade. We defined the greatest percentage drop for each cascade as the ‘key break point’ for that country, so that they can identify their main area of attrition.
UNAIDS 90-90-90 target definitions.
Break point analysis was calculated for each country by plotting the percentage of people retained for target one versus target two and also for target two versus target three. As so few countries yet meet the 90% targets, we separated these graphs into four quadrants using cut-offs of 65% to allow countries to see what targets to focus on. A similar method was used in a recent cascades analyse (with a 60% cut-off), which modelled potential reductions in incidence if the 90-90-90 targets were to be met.27
Findings
Global estimates
Figure 1A summarises the 90-90-90 targets and figure 1B illustrates the estimated number of people currently in each stage worldwide. Globally, of all HIV positive people, an estimated 54% were diagnosed,11 41% were on ART11 and 32% were estimated to achieve viral suppression.11 ,12 This means that globally, break points are 54% at diagnosis, 76% of those diagnosed are on treatment and 78% of those on treatment achieve viral suppression. The gaps illustrate that 13.4 million more people need to be diagnosed, we have to double the number currently on ART and a further 15.3 million people and to achieve undetectable HIV RNA in order to reach these targets. Furthermore, the numbers of people diagnosed, on treatment and suppressed may be overestimated, due to sampling bias or incomplete reporting, as well as migration; making it difficult to track of many HIV positive people.

Compares the UNAIDS targets for 2020 with global estimates for 2014/15.
National cascade analysis
Of the 196 countries searched, data were found for 69 countries (32 complete, 37 partial), outlined in online supplementary table S1. Detailed summaries of all country data and definitions used are presented in the supplementary appendix figures 2.01–2.69, cascade data were either incomplete or excluded for 127 countries.
Supplementary appendix figures 2.01–2.69
Supplementary table S1
Figure 2Ai, Aii shows a comparison across 32 countries with full cascades and 23 countries with partial cascades, where data were available for target one, that is, diagnosis. While no country reached the 90% target for HIV diagnosis, there is a wide range from 87% (the Netherlands and Estonia) to 11% (Yemen).

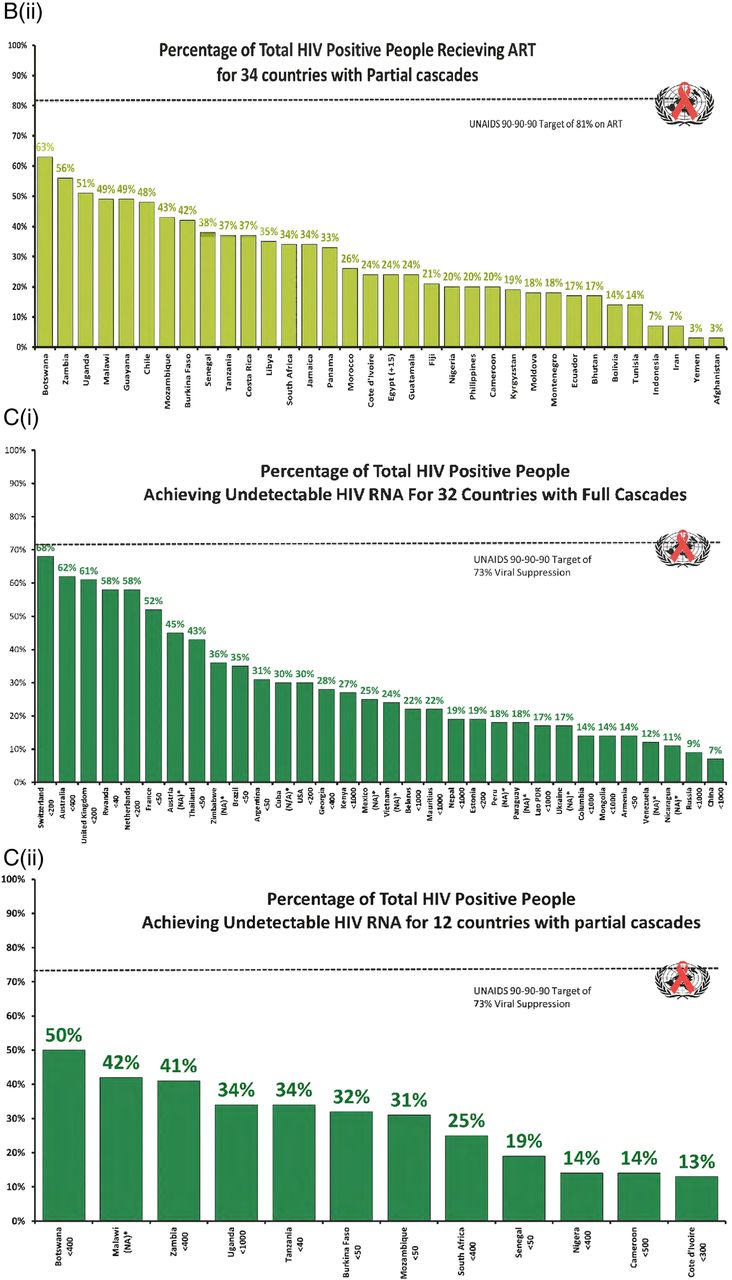
A(i) Percentage of total HIV positive people receiving diagnosis for 32 countries with full cascades. A(ii) Percentage of total HIV positive people receiving diagnosis for 23 countries with partial cascades. B(i) Percentage of total HIV positive people receiving ART for 32 countries with full cascades. B(ii) Percentage of total HIV positive people receiving ART for 34 countries with partial cascades. C(i) Percentage of total HIV positive people achieving undetectable HIV RNA for 32 countries with full cascades. C(ii) Percentage of total HIV positive people achieving undetectable HIV RNA for 12 countries with partial cascades.
Continued
Figure 2Bi, Bii compares results for 32 countries with full cascades and 34 countries with partial cascades, where data were available for target two, that is, treatment coverage. No country reached the overall 81% target for ART coverage. Results ranged from 71% (Switzerland) to 3% (Afghanistan and Yemen).
Figure 2Ci, Cii compares results for target three for 32 countries with full cascades and 12 countries with partial cascades respectively, where data were available for target three, that is, viral suppression. Viral load threshold used varied from <40 (Rwanda, Tanzania) to <1000 (Russia, Uganda, Kenya, Belarus, Mauritius, Nepal, Lao, Columbia, Mongolia and China) HIV RNA copies/mL. No country reached the overall target for viral suppression of 73% of all HIV positive people. The range of virally suppressed individuals is from 68% (Switzerland) to 7% (China).
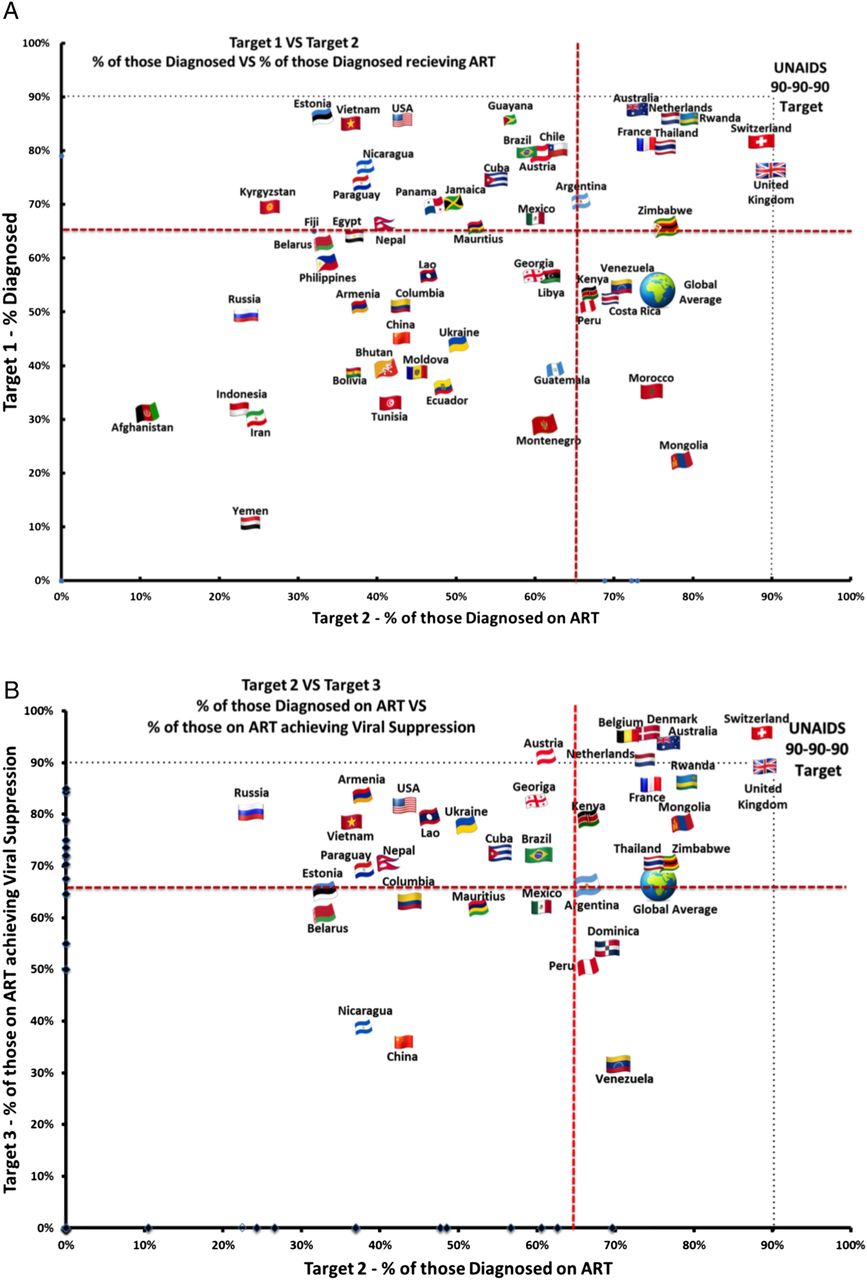
Figure 3A illustrates the break points for 53 countries with available data for targets one and two. Break points are drawn at the 90% mark, and these figures are separated into four quadrants. Countries that are the closest to targets one and two are clustered in the upper right quadrant of the graph. The UK is the only country to meet target two (with 76% diagnosed, 90% of those diagnosed receive treatment) followed by Switzerland (81% and 88%, respectively). Countries in the upper left quadrant are doing well at testing but need to focus on proving ART to those diagnosed. Those in the lower right quadrant are doing poorly at testing but are doing well at treating those diagnosed, for example, Mongolia diagnosed 23% but 78% of those received treatment with similar findings for Morocco (35% and 75%, respectively). The furthest countries from achieving target one and two are in the lower left quadrant, for example, Afghanistan (31% diagnosed and 11% of those diagnosed on treatment), Iran (30% and 24%, respectively) and Yemen (11% and 24%, respectively).
(A) Target 1 vs Target 2 - % of those diagnosed vs % of those diagnosed receiving ART. (B) Target 2 vs Target 3 - % of those diagnosed on ART vs % of those on ART achieving viral suppression.
Figure 3B compares 35 countries with available data for targets two and three. Countries closest to these targets are clustered towards the top of the upper right quadrant. Seven countries meet or exceed target three with over 90% of those on treatment achieving viral suppression (Austria, Belgium, Denmark, the Netherlands, Australia, Switzerland and the UK). Countries in the lower right quadrant still perform relatively well at providing ART to those diagnosed, but fail to achieve viral suppression for those on treatment, for example, Venezuela (70% of those diagnosed received ART and 31% of those on treatment achieved viral suppression). Countries in the upper left quadrant performed poorly at diagnosis, but maintained relatively good viral suppression rates for those on treatment. The countries furthest from achieving targets two and three are in the lower left quadrant of the graph, where diagnosis rates and viral suppression rates are low, for example, China (43% and 36%, respectively) and Nicaragua (38% and 39%, respectively).
Discussion
Wide disparities were observed between HIV treatment cascades for the 69 countries evaluated. As anticipated, we encountered multiple discrepancies in the methodologies and reporting systems used by each country, which limits the overall findings discussed below. However, this analysis provides novel and important insight into where the main gaps in the cascade are for each country. Large randomised community trial results show 90-90-90 targets are achievable with planning, political will and funding.14 ,28 To allow accurate comparisons, standardised and continuous global monitoring of HIV care outputs should become a priority.10
Diagnosis
Results for target one depend greatly on several factors such as the total epidemic size estimation method, testing technology, data collection method and modelling of errors. With improved epidemic modelling tools such as Spectrum being widely used, this will become more uniform.17 To enhance reliability, some countries use anonymous seroprevalence surveys (eg, UK19) in generalised cohorts. Diagnosis reporting, requires unique patient identities which is not always feasible in many settings meaning double counting may occur.17
Countries with high diagnosis rates were mostly high-income European or South American. Multiple factors influence the uptake of HIV testing coverage29 and these can be categorised as individual,30 structural6 ,9 (eg, healthcare system capacity) and societal barriers (eg, stigma31). HIV testing kits are cheap and many countries test for free,17 but encouraging HIV testing behaviour in high-risk communities is challenging.28 Furthermore, to achieve significant and sustained impact on the epidemic, encouraging repeat HIV testing is necessary.32 ,33 Interventions to improve diagnosis include educational and behavioural programmes and campaigns to reduce discrimination.31 To address the significant shortfall at diagnosis in resource-limited settings, innovative approaches to increase testing coverage have been explored. These include partner testing,34 community-based interventions (eg, TasP,14 PopART28 and SEARCH trials14), opt-out testing,34 self-testing35 and work-based or home-based community testing (HBCT)36 which was shown to reach up to 80% coverage of testing in high-burden countries, but may not be cost-effective in low-prevalence countries. Cost-effectiveness modelling has shown that HBCT will improve diagnosis but will not be enough without strong linkage and ART coverage, and ‘front-loading’ may be required to optimise efficiency.37
Treatment
The wide diversity observed between countries for the number of people ‘on ART’ in the cascade is multifactorial including; sociocultural determinants,38 structural barriers,9 costs of services and medicines,39 healthcare facility capacities9 and drug availability stock-outs.32 Countries where the greatest break point was at ART provision to those diagnosed, and countries in the upper and lower left quadrants of figure 3B need to develop creative strategies to link, retain and treat those diagnosed. The RapIT study found, immediate or same day ART initiation following diagnosis is very effective in low-resource settings.40
Linkage to care, retention in healthcare systems34 and eligibility for ART (as directed by national guidelines) impact the step from diagnosis to successful treatment.41 However, due to lack of consistency in definitions across countries, these steps between testing and ART initiation are not possible to accurately compare due to heterogeneity. For example, in Russia23 ‘linkage’ was constituted by ‘one visit to an AIDS centre within 12 months of diagnosis’. Contrastingly, in the USA, linkage was defined more stringently as ‘one CD4 test performed within 3 months of diagnoses.18’ The number of people ‘on ART’ is also an imprecise value, even if calculated from prescription records, not everyone prescribed ART actually receives or adheres to it. Adherence, a common factor in treatment failure,9 was rarely reported (eg, France, 60%20) and was inconsistently defined, therefore, we did not compare countries at this stage. Viral suppression or post ART retention are more important final markers for successful treatment26 as prevention of viral transmission3 ,42 and to reduced morbidity and mortality.2
Healthcare system differences may impact ART coverage, in particular public versus private provision of treatment.38 Financial constraints were barriers in Australia where copayments were required and treatment was not free for all (such as migrants).43 Task shifting,44 where specially trained non-medical staff initiates ART, has helped improve ART coverage challenges in some resource-limited settings.45 This can decongest clinical facilities when healthcare facility capacity is constrained. Our analysis is limited as country data range from 2010 to 2014, and some countries have experienced monumental coverage increases over this period.11 However, this is promising news for the countries struggling to reach target two and for the global community aiming to reach the 90-90-90 targets by 2020.
Viral suppression
Of the 32 full cascades analysed that reported viral suppression data, all achieved undetectable HIV RNA for over 50% of people receiving ART, except for China, Nicaragua and Venezuela. Sustained maintenance of viral suppression is not always reflected here, because cross-sectional studies may only report one viral load measurement. Not all countries reported data for viral suppression and many reflected ‘on treatment’ analysis and cannot account for those lost to follow-up. For the 10 African countries, where viral suppression was estimated from combining country-level reports11 with a systematic review,25 these results may not represent the true levels due to selection bias in the studies. The definition of undetectable HIV RNA varied from <50 RNA copies/mL (eg, France20) to <1000 RNA copies/mL (eg, Russia23). Brazil has 35% (255 000) of HIV positive people achieving undetectable HIV RNA using the <50 RNA copies/mL definition; however, if the <1000 copies/mL definition was used, this would rise to 40% (293 000).46
Age, ethnicity and socioeconomic status are associated with percentage achieving undetectable HIV RNA in the USA, possibly reflecting healthcare funding.47 Structural barriers impact viral suppression. In low and middle-income countries, barriers to treatment retention, drug stock-outs and loss to follow-up remain obstacles for successful outcomes.9 Simplification of treatment to single fixed-dose combinations, community delivery of therapy, simplification of pathways to repeat prescriptions48 and adherence clubs may all enhance treatment effectiveness.
Variation within country cascades
Most of the cascades analysed in this study were cumulative cross sectional or were longitudinal and cross-sectional analysis combined. Cross-sectional studies are simpler and cheaper for large populations; however, participants may exit and return at various stages, meaning they could be counted twice or not be counted at all within the time frame of data collection. Longitudinal studies track patients continuously and allow relatively fewer points where patients may be lost to follow-up and facilitate assessment of annual changes. Countries closest to approaching the 90-90-90 goals, in the upper right quadrants in figure 3A, B, are generally high-income, low-prevalence, except for Rwanda,24 Thailand49 and Zimbabwe.17 ,25 Other high-burden, lower-income countries could learn from their systems and successes.
Conclusion
Of the 69 countries included in this analysis, none currently meet the three 90-90-90 targets. The ‘key break point’ globally is HIV diagnosis, whereas the most common break point for the countries analysed here was between diagnosis and provision of ART. Multiple factors influence the success of the HIV treatment cascade such as epidemic stage, population demographics, healthcare systems, treatment costs and policy and treatment guidelines. In order to develop better methods to analyse and compare cascades, standardised reporting tools, better monitoring and timely reporting are required.
Note to all readers:
This research was constructed using the most recent publicly available data as of September 2015. We would warmly welcome any more recent or more reliable national-level data, from all countries not yet included, or updates to the 69 included countries, for a follow-up to this project.
References
Footnotes
JL and AR have collaborated and contributed equally and would like to be acknowledged as joint first author.
Handling editor Seye Abimbola
Contributors AH and AP designed the project. JL and AR compiled data from treatment cascades by country and analysed the data. PK and PV contributed data from the Swiss HIV cohort. All authors critically reviewed and approved the manuscript. No patient consent needed.
Funding This project was funded by an unrestricted education grant from the St Stephens AIDS Trust, London, UK.
Competing interests None declared.
Provenance and peer review Not commissioned; externally peer reviewed.
Data sharing statement We permit the sharing of data from this research article. All data published in this article are available publicly in the online supplementary appendix and references list the sources of data.