Article Text

Abstract
Objective Significant haemodynamic changes occur at delivery impacting organ blood flow distribution. We aimed to characterise Doppler indices patterns over time in three different organs (brain, gut and kidney) and test them as measures of vascular resistance.
Design Observational cohort study. Serial Doppler interrogations of the anterior cerebral, superior mesenteric and renal arteries within 2 hours, 2–6, and 24 hours of life, in combination with central haemodynamic data.
Patients Healthy, near-term (>36 weeks of gestation) neonates.
Outcome measures Pulsatility (PI) and Resistance Indices (RI) patterns and organ-specific conductances, detailed echocardiographic haemodynamic measures.
Results Twenty-one babies were studied. Doppler morphology and adaptation patterns were distinctly different between the organs (brain, gut and kidney) supporting autonomous vascular regulatory effects. The PI differentiated especially between kidney and other organ flow consistently over time. PI and RI for all three organs decreased. The variance in organ conductance did not explain the variance in 1/PI, indicating that PI is not a measure of resistance. Superior mesenteric artery had the highest velocity with 72 cm/s. Non-invasively acquired pilot serial values in a normal population are given. Patent ductus arteriosus flow remained open at discharge for 36%.
Conclusions Haemodynamic transitioning patterns assessed by serial Dopplers in healthy near-term neonates differ in brain, gut and kidney: Doppler waveform morphology differs, and PI differentiates renal Doppler morphology, compared with the other organs. While PI and RI decline for all organs, they do not measure resistance. Brain artery velocity increases, mesenteric perfusion is variable and renal Vmax decreases.
- neonatology
This is an open access article distributed in accordance with the Creative Commons Attribution Non Commercial (CC BY-NC 4.0) license, which permits others to distribute, remix, adapt, build upon this work non-commercially, and license their derivative works on different terms, provided the original work is properly cited, appropriate credit is given, any changes made indicated, and the use is non-commercial. See: http://creativecommons.org/licenses/by-nc/4.0/.
Statistics from Altmetric.com
What is already known on this topic?
Cerebral blood flow increases throughout pregnancy, then briefly decreases during the transition after birth, finally increasing again within the first 5 days of life.
Doppler surveillance in pregnancy has been shown to reduce adverse events. An adverse antenatal flow pattern is associated with adverse pregnancy and neonatal outcomes.
In the neonate, Doppler-derived indices are correlated with growth status, disease severity and outcomes in hypoxic-ischaemic encephalopathy and may differentiate those with anaemia.
What this study hopes to add?
Non-invasively acquired serial measures for organ perfusion adaptation in healthy, near-term infants are given which serve as references to more immature or pathological conditions.
Organ patterns of transition are different: While Doppler indices for each organ decline with time, brain velocity increases, kidney velocity decreases and gut blood flow is variable.
PI and RI are descriptors of flow pulsatility but were not associated with organ conductance, and, therefore, do not represent a measure of end-organ resistance.
Background
During the course of transitioning from intrauterine to extrauterine life, neonatal haemodynamics undergo dramatic changes. Rising oxygen tension with the first breaths and elimination of the high-conductance placenta decrease both pulmonary vascular resistance and systemic conductance. At birth, shunting of the pulmonary vascular bed via the ductus arteriosus ceases. Ductal flow changes from right-to-left to bidirectional and finally left-to-right with functional closure between 12 and 24 hours.1 Thus, these changes result in conversion from an in-parallel circuit in-utero to a mature in-series newborn circulation.
Within 20 min after birth healthy neonates decrease their heart rates and increase ventricular stroke volumes; middle cerebral artery (MCA) mean flow velocities decrease (from 34±13 to 24±7 cm/s) with an inverse relationship to patent ductus arteriosus (PDA) flow.2 Associated with PDA closure left ventricular output (LVO) increases, along with a rise in systemic blood pressure. Details on peripheral organ blood perfusion have been mainly studied in the brain.3 4 Cerebral blood flow (CBF) increases during pregnancy to decrease shortly after birth, then increases again within the first 5 days.2 5 6 A range of physiologic and pathological parameters may effect neonatal transition, such as timing of cord clamping, placental, maternal and neonatal disturbances such as pre-eclampsia, chorioamnionitis or prematurity.
There are wide clinical applications for Doppler flow ultrasonography. Uterine-artery Doppler-derived pulsatility index (PI) and resistance index (RI) decrease throughout gestation.7 8 In the neonate, an adverse antenatal flow pattern, such as absent or reverse, end-diastolic uterine artery flow is associated with preterm delivery, necrotising enterocolitis or long-term endothelial dysfunction implicating risk for future metabolic syndrome.9 Doppler-derived cranial PI and RI have been shown to vary between appropriate and small for gestational age (SGA) infants,5 and to distinguish those with anaemia.10 Furthermore, they correspond with disease severity and outcomes in neonates with hypoxic-ischaemic encephalopathy.11 12
While mean blood flow velocity is often used to describe organ perfusion, Doppler-derived indices may add information regarding pattern evolution over time. The PI, or Gosling index, was derived as an assessment tool for distal arterial perfusion, and decreases with increasing severity of a stenosis.13 It is assumed that changes in vessel diameter are small, so that velocity is proportional to flow.14 PI and RI are related measures of arterial pulsatility, based on echo-Doppler measurements of arterial blood velocity variability throughout the cardiac cycle.15 They are derived from the ratios between maximum systolic and minimum diastolic velocity, as well as mean velocity, independent of absolute velocity or angle of insonation.16 PI is inversely proportional to mean velocity, and RI is inversely proportional to maximum systolic velocity. While they characterise pulsatility of flow, claims that they measure resistance have not been substantiated.15 17 In this study, we measured organ conductance directly. If PI and RI were measures of resistance, 1/PI and 1/RI should vary directly with conductance.
As defined by Ohm’s law, conductance (G), the reciprocal of resistance (R), is defined as the amount of blood flow a vascular bed will allow for a given driving pressure ( ).
).  is the pressure differential, gradient or driving pressure, and equals the mean aortic pressure (
 ) minus the central venous pressure
 .18 Conductance offers distinct advantages. Systemic organs are arranged in parallel in that they all have essentially equal arterial and venous pressures. The total conductance of the systemic circulation is simply the sum of the conductances of each organ. Mathematically, conductances can be added or subtracted, whereas resistances cannot.
Rationale
There are limited data on central and peripheral blood flow, organ perfusion and flow distribution during haemodynamic transitioning immediately after delivery in healthy near-term neonates. We aimed to characterise PI/RI patterns over time in three different organs (brain, gut and kidney) and test them as measures of vascular resistance. Also, we wanted to gather detailed haemodynamic information, such as central cardiac outputs (COs) and PDA status, heart rate (HR), blood pressure (BP), and peripheral oxygen saturation (SpO2). Values for pathological adaptations such as in premature, sick or such with antenatal adverse vascular patterns may be compared in the future.
Methods
This is a prospective observational cohort study in healthy or near-term neonates (≥36 weeks of gestation) born at Rockyview General Hospital in Calgary between March and October 2017. Babies were included after notification of the study team by obstetrical staff when suitable labouring mothers had been identified and consented. Infant’s and mother’s characteristics were obtained from their respective charts. Growth status was defined in relation to the Fenton 2013 charts.19
Inclusion criteria
Babies born at ≥36 weeks of gestation.
Exclusion criteria
Suspected or confirmed congenital anomaly, palliative condition or factors known to prolong neonatal transitioning20: Maternal selective serotonin re-uptake inhibitor; maternal diabetes, known uterine artery adverse Doppler changes; clinical suspicion of persistent pulmonary hypertension of the newborn.
Study procedure – At each of three time points, within 1–2 hours of delivery (Time 1), at 4–6 hours (Time 2) and 24–48 hours of life, or just before discharge (whichever was earlier, Time 3), the following parameters were obtained.
Echocardiographic assessment of LVO and right ventricular output (RVO), PDA, measured at the pulmonary side: presence, directionality of blood flow (left, right or bidirectional) and size, defining large as >2.0 mm, moderate as 1.5–2.0 mm and small as <1.5 mm. Bidirectional flow was any right-to-left ductal shunt continuing no more than 30% of the cardiac cycle.21 Ultrasound interrogation of the anterior cerebral artery (ACA), superior mesenteric artery (SMA, independent of feeding status) and renal artery (RA).
Each investigation was performed by one of two neonatologists (PM/AS) using a GE Vivid I ultrasound machine with an 8–12 MHz vector array transducer using 2D, colour flow and pulsed wave Doppler. Velocity time integrals (VTI) were determined by averaging the area under curve of up to three consecutive Doppler waveforms, if available. HR and SpO2 were both measured via pulse oximetry on the right upper limb, and BP, via an oscillometric device with appropriately sized cuff (size 3 or 4) on the right arm, in a quiet physiological state immediately after the echocardiographic assessment, on an intermittent basis.
Primary Outcome
Serial PI patterns over time and comparison between the three organs.
Secondary Outcomes
PI/RI as measures of vascular resistance; 1/PI and 1/RI were compared with conductance. Serial RI patterns and organ blood flow over time; HR, BP, SpO2; LVO, RVO, tricuspid regurgitation (TR), and PDA flow.
Analysis
Calculations were made later, away from bedside (table 1). Annular diameter (D) of aortic and pulmonic valves measured from the four-chamber and short-axis views, respectively. Peripheral vessel diameter after amplification of 2D images. Cross-sectional area (CSA) of the annulus of aorta and pulmonic artery (PA) as well as peripheral arteries derived via [π x (D/2)2], then calculation of stroke volume as SV=VTI x CSA, where VTI is the time–velocity integral. Indexed CO centrally and organ perfusion peripherally was derived as SV x HR/birth wt (BW).22
Pulsatility index=PI ((peak systolic–end diastolic velocities)/mean flow velocity)
Resistance index=RI ((peak systolic–end diastolic velocities)/peak systolic velocities)
Relative PI and RI: Data were normalised to the baseline value (Time 1).
Conductance: (normalised) organ flow/arterial pressure ≃ VTI×CSA× hour/mean BP
Used indices and their derivation
Statistical analysis
Descriptive analyses regarding demographic, perinatal and neonatal characteristics of infants were performed by using SAS V.9.4. Mean and SD were provided for continuous variables, while frequencies and relative percentages were reported for categorical variables. The distributions of continuous variables were examined for skewness and normality using Kolmogorov-Smirnov tests. The mixed model analysis of variance tests and repeated measures logistic regression tested the difference between groups for continuous and discrete variables, respectively. A two-tailed p value of less than 0.05 was deemed significant.
Patient involvement
There was no involvement of patients in the study design, analysis or dissemination.
Results
Twenty-one babies were studied (table 2), two were discharged before time 3. Sixty-one scans were taken, 56 (93%) by one neonatologist (AS). One baby required 48 hours of NICU admission for transient tachypnea of the newborn and the second 72 hours for mild hypoxic-ischaemic encephalopathy. Hospital records of all infants up to a median of 12 months (range 8–18 months) in a unified healthcare system confirmed no significant cardiopulmonary disease in any participant. HR decreased, BP remained stable over time (table 3) and SpO2 always exceeded 94%.
Population characteristics
Vital signs and central haemodynamic parameters
Both PI (figure 1) and RI differentiated between RA and ACA and between RA and SMA at time 1 and remained different between RA and ACA for times 2 and 3. Typical Doppler flow curves’ morphology varied characteristically according to organ system interrogated (figure 2). For all three organs, both PI and RI decreased significantly over time (table 4). The normalised PI showed a significant within-organ drop between times 1 and 3 for all organs, and between Times 1 and 2 for RA, whereas the normalised RI showed a significant change between times 1 and 3 for both RA and SMA (figure 3A,B).

Pulsatility index (PI) between organs at time 1; *statistically significant differences (p<0.05).

Doppler morphology according to organ: (A) brain, (B) gut, (C) kidney: flow velocity in m/s over time. Note that diastolic flow is greatest in the brain, less in the SMA and almost absent in the kidneys. ACA, anterior cerebral artery; RA, renal artery; SMA, superior mesenteric artery.
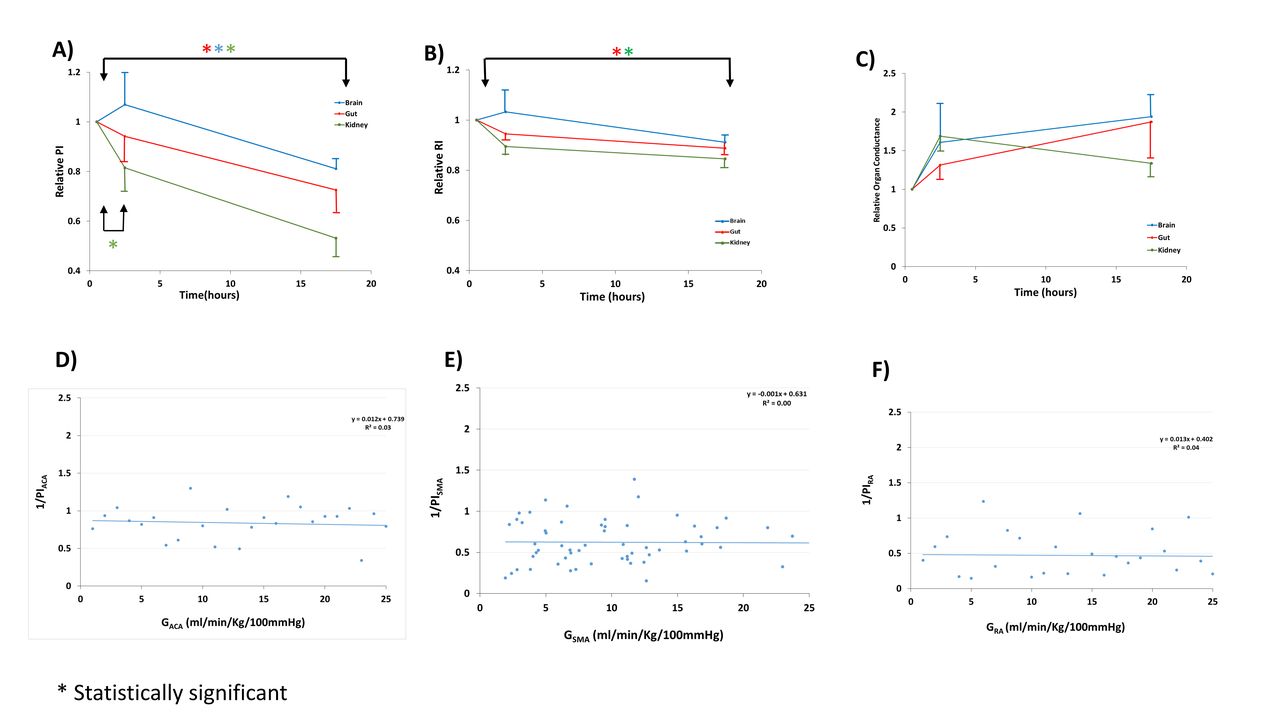
Relative PI (A), RI (B), and organ conductance (C). Brain data are given in blue, gut data in red, and renal data in green. The indicated times are the median values: time 1, 1 hour; time 2, 4.3 hours and time 3, 26 hours. Comparison of organ-specific 1/PI and conductance in ACA (D), SMA (E), and RA (F). *Statistically significant differences (p<0.05). ACA, anterior cerebral artery; PI, pulsatility index; RA, renal artery; SMA, superior mesenteric artery.
Peripheral haemodynamic variables
The SMA showed the highest blood flow and largest variation with mean 16.1 mL/kg/min (SD 9.7, table 4), compared with brain with 5.8 mL/kg/min (SD 3.7) and kidney with 6.9 mL/kg/min (SD 9.4). SMA also had the highest Vmax with 70.6 cm/s (table 4). There were no significant changes to organ flow over time for any organ. Vmax of ACA significantly increased from 30.0 to 30.5 to 36.2 cm/s, in contrast to RA Vmax with a trend to decrease, and SMA Vmax remaining constant (table 4). Because PI and RI have been taken as a measure of resistance and because resistance is the reciprocal of conductance, we plotted relative conductance for the three organs (figure 3C), and 1/PI versus its respective conductance for ACA, SMA and RA (figure 3D–F). The claimed measure of conductance with 1/PI did not correlate with the organ flow. Each slope was essentially zero and R2 ~0, indicating that the variance in organ conductance explained none of the variance in 1/PI. PI (and RI) are not measures of resistance.
Neither the aortic nor the pulmonic Vmax changed significantly over time; however, both respective central outputs (LVO and RVO) decreased significantly (table 3). PDA flow (if any) decreased significantly from being present in 20/21 infants during Time 1 and 2 to 7/19 infants at Time 3 (table 5). The most common PDA flow pattern was small left-to-right flow over the first two time points with closure at Time 3 in 6/21 (table 5). Two of the initial bidirectional PDA were large, nine additional bidirectional measurements were moderate and four left-to-right PDA were moderate. No infant had a bidirectional PDA flow at Time 3 and 7/19 infants had a small residual left-to-right PDA shunt at Time 3. Mild TR was noted in 5/21 at Time 1 and in 3/19 (different babies) at Time 3.
PDA flow patterns over time
Discussion
To our knowledge, this is the first study designed to characterise differential organ haemodynamic perfusion patterns in transitioning neonates.
The three organs described had distinctly different typical Doppler flow curve shapes (figure 2). In keeping with that, PI differed between RA and SMA, as well as RA and ACA at Time 1 (figure 1), and remained significantly different between RA and ACA at Times 2 and 3. Our data substantiate the concept of independent autoregulation of blood flow in different organs in euvolaemic states with normal cardiac function.23 This concept has been widely adopted for cranial perfusion regulation in the neonate where it plays a crucial role in preventing white-matter injury and intraventricular haemorrhage in premature infants.24 Furthermore, in intrauterine animals it has been shown that in hypovolaemia, splanchnic perfusion gets sacrificed to preserve vital organ blood flow, indicating the independent organ-specific nature of this autoregulation.25
In testing PI and RI for their correlation to vascular resistance, we expected that 1/PI would be linearly related to organ conductance. As shown in figure 3D–F, the variance in organ conductance explained none of the variance in 1/PI (this was similarly true for RI, not shown). One must therefore conclude that they are not measures of vascular resistance. They may, however, confer additional rheological information.
In our cohort, both PI and RI declined for all organs during the first 24 hours (figure 3A,B). Our earliest values (taken within 1–2 hours of delivery) correspond to the prenatal uterine artery PI measurements which reach about 0.65 at term.7 Renal values were the highest at birth and decreased significantly thereafter. Likely renal adaptation was not complete, as seen in animal studies.4 ACA RI was previously reported in the range of 0.82, similar to ours.26 PI measurements of ACA in previous studies were 0.75 at 24 hours and decreasing, whereas our values were higher with 1.57 at 24 hours and also decreasing.5
Our Vmax of 70.6 cm/s in the SMA at 24 hours corresponds well to previously reported values of 38–90 cm/s with increasing pattern.3 There seems to be a wider range of values for the splanchnic perfusion at each time point in our study, similar to previously reported.3 Splanchnic organs blood flow was previously reported as 43±13 mL/kg/min in one study which corresponds to our values.27 The pattern might indicate a continuous low resistance, high perfusion with high variability pattern, similar to what is seen in NIRS studies.28 Feeding is known to increase splanchnic flow in response in term babies.3 The variability of feeding timing and amount in the first 24 hours of life may also explain some of the variation. Only 2.5%–4% of CO is received by the kidney at birth.29 Renal blood flow was previously reported as 21±5 mL/kg/min within 1 week of life, compared with our data within hours of birth when renal adaptation may be incomplete.30
Our cerebral values correspond to those of Noori et al who measured MCA) Vmax of 24 increasing to 29 cm/s in the first hours of life,2 and Cheung et al whose values were 28 increasing to 38 cm/s with lower values in SGA infants.5 Brain blood flow was previously estimated to be between 13.9±0.6 mL/100 g tissue/min31 and 18 mL/100 g/min, which correspond to about 20 mL/kg BW/min with all vessels supplying the brain taken together.32 Since we are only measuring one single cerebral artery, our data might only describe a fraction of the more redundant cerebral blood flow. The brain was the only organ with an increase in arterial velocity (table 4), which, assuming euvolaemia, normal respiratory function maintaining eucapnia, and normal cardiac function, makes us speculate that brain blood flow increases due to a low resistance vascular pattern.33 Organ flows and indices differ distinctly, supporting independent vascular regulation of flow, arguably via paracrine and autocrine mechanisms.
Adaptation after birth showed characteristic changes with HR decreases and often an increase in BP where we show stable values, likely due to our time limitation of 24 hours.2 The normal SpO2 measurements at all time points ruled out any major cardiac or pulmonic disease in our asymptomatic population. Our LVO and RVO values of 159 and 244 mL/kg/min, within 1–2 hours of age were similar to previously described 141 and 211 mL/kg/min, respectively.2 34 The consistently lower values of LVO were likely due to shunting via the persistent foramen ovale (PFO). The central outputs decreased over time in contrast to a recent study where LVO remained stable.34
In our cohort, one-third had discernible PDA flow at the time of discharge. The closure patterns varied widely (table 5), with 4/21 babies having sustained bidirectional flow at Time 2. This speaks of the importance of keeping normal transitional haemodynamics in mind which are infrequently imaged, when evaluating the ‘sick’ or premature neonate, as this slight delay in fall of pulmonary resistance seemed to be within normal limits for our term transitioning neonatal population.
A group of five infants had a persistent PDA until Time 3 and displayed mild TR at birth which persisted to Time 2 but disappeared in all at Time 3. Another group of three babies, in contrast, developed TR only at Time 3 with the PDA closed at that time. We speculate about different physiological reasons for TR in these two populations. In the first group of infants with TR, the most likely reason is high pulmonary resistance. In the second group, we hypothesise the TR was a manifestation of a transient haemodynamic response to PDA closure. While this may not be of any physiological significance, clinically this may explain an examination finding of a new onset murmur in an infant.
We suggest that our observations may be used as pilot values for normal adaptation patterns of dynamic organ perfusion in the first 24 hours of life. These measurements were non-invasively obtained serially at bedside and may be compared with pathological adaptation in altered or immature physiology.
Limitations
The number of babies was small and there was no measurement after discharge. The majority of measurements but not all was done by one author, precluding inter-rater reliability measurements. We did not assess PFO flow. We did not take feeding status or voiding into account. Due to variability in practice, only half of participants receive >60 s of delayed cord clamping.
Conclusion
Haemodynamic transitioning patterns assessed by serial Dopplers in healthy near-term neonates are distinctly different in the brain, gut and kidney. Doppler waveform morphology differs and PI differentiates renal Doppler morphology, compared with the other organs. PI and RI decline for all organs over time. As 1/PI was independent of conductance, PI is not a measure of resistance. While the brain Vmax increases over time, the kidney Vmax shows a trend to decrease, while the mesenteric perfusion is widely variable.
Peer review was not commissioned and authors' response to reviewers' comments are available as supplementary file with the online version.
Supplemental material
References
Footnotes
Patient consent for publication Parental/guardian consent obtained.
Contributors AS: Planned conception and design, conducted, analysed, interpreted and reported. PM: Helped plan and design, helped conduct and helped report. SK: Helped plan and design, recruitment and helped report. VK: Helped plan and design and helped report. LZ: Statistical support. SH: Helped analyse data and report. JT: Helped plan and design, analysis and data presentation, and report.
Funding The authors have not declared a specific grant for this research from any funding agency in the public, commercial or not-for-profit sectors.
Competing interests None declared.
Ethics approval Research Ethics Board (REB) approval was obtained (REB16-2493).
Provenance and peer review Not commissioned; externally peer reviewed.
Data sharing statement There is no additional unpublished data from the study.